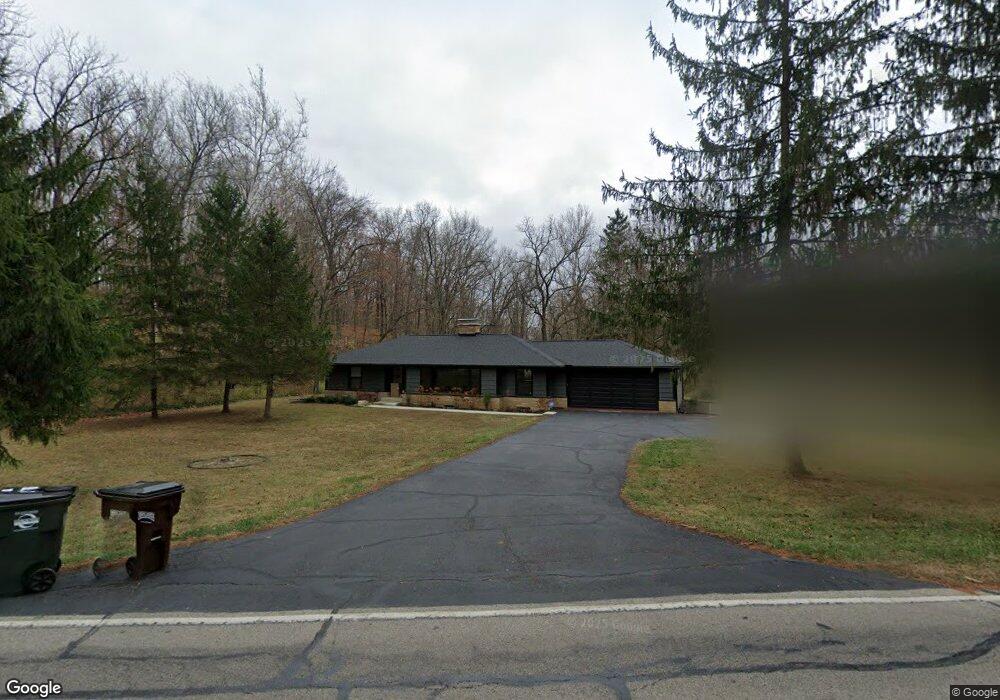
2680 Little York Rd Dayton, OH 45414
Estimated Value: $350,000 - $438,016
4
Beds
2
Baths
2,400
Sq Ft
$159/Sq Ft
Est. Value
About This Home
This home is located at 2680 Little York Rd, Dayton, OH 45414 and is currently estimated at $381,672, approximately $159 per square foot. 2680 Little York Rd is a home located in Montgomery County with nearby schools including Helke Elementary School, Morton Middle School, and Butler High School.
Ownership History
Date
Name
Owned For
Owner Type
Purchase Details
Closed on
Jan 18, 2022
Sold by
Brubaker Matthew and Brubaker Lauren
Bought by
Witt Rachel Nicole
Current Estimated Value
Home Financials for this Owner
Home Financials are based on the most recent Mortgage that was taken out on this home.
Original Mortgage
$349,200
Outstanding Balance
$323,680
Interest Rate
3.56%
Mortgage Type
New Conventional
Estimated Equity
$57,992
Purchase Details
Closed on
Oct 26, 2020
Sold by
Lauren Foundation
Bought by
Brubaker Matthew and Brubaker Lauren
Purchase Details
Closed on
Feb 11, 2005
Sold by
Haber Jill A
Bought by
Lauren Foundation
Purchase Details
Closed on
Jun 25, 1999
Sold by
Nash Steven P and Nash Ruth A
Bought by
Haber Jill A
Home Financials for this Owner
Home Financials are based on the most recent Mortgage that was taken out on this home.
Original Mortgage
$116,720
Interest Rate
7.29%
Create a Home Valuation Report for This Property
The Home Valuation Report is an in-depth analysis detailing your home's value as well as a comparison with similar homes in the area
Home Values in the Area
Average Home Value in this Area
Purchase History
| Date | Buyer | Sale Price | Title Company |
|---|---|---|---|
| Witt Rachel Nicole | -- | Chicago Title | |
| Brubaker Matthew | $185,000 | None Available | |
| Lauren Foundation | $151,800 | None Available | |
| Haber Jill A | $145,900 | -- |
Source: Public Records
Mortgage History
| Date | Status | Borrower | Loan Amount |
|---|---|---|---|
| Open | Witt Rachel Nicole | $349,200 | |
| Previous Owner | Haber Jill A | $116,720 |
Source: Public Records
Tax History Compared to Growth
Tax History
| Year | Tax Paid | Tax Assessment Tax Assessment Total Assessment is a certain percentage of the fair market value that is determined by local assessors to be the total taxable value of land and additions on the property. | Land | Improvement |
|---|---|---|---|---|
| 2024 | $7,945 | $129,110 | $23,400 | $105,710 |
| 2023 | $7,945 | $129,110 | $23,400 | $105,710 |
| 2022 | $7,043 | $91,190 | $16,480 | $74,710 |
| 2021 | $3,537 | $45,590 | $16,480 | $29,110 |
| 2020 | $3,527 | $45,590 | $16,480 | $29,110 |
| 2019 | $3,957 | $45,710 | $14,830 | $30,880 |
| 2018 | $3,964 | $45,710 | $14,830 | $30,880 |
| 2017 | $3,940 | $45,710 | $14,830 | $30,880 |
| 2016 | $4,008 | $45,610 | $16,480 | $29,130 |
| 2015 | $3,806 | $45,610 | $16,480 | $29,130 |
| 2014 | $3,806 | $45,610 | $16,480 | $29,130 |
| 2012 | -- | $45,970 | $16,480 | $29,490 |
Source: Public Records
Map
Nearby Homes
- 3114 Northerton Ct
- 7568 Yorkshire Dr
- 7562 Yorkshire Dr
- 3166 Little York Rd
- 7052 Society Ct
- 7042 Society Ct
- Bellamy Plan at Yorkshire Reserve - The Oaks at Yorkshire Reserve
- Newcastle Plan at Yorkshire Reserve - The Oaks at Yorkshire Reserve
- Chatham Plan at Yorkshire Reserve - The Oaks at Yorkshire Reserve
- Holcombe Plan at Yorkshire Reserve - The Oaks at Yorkshire Reserve
- Milford Plan at Yorkshire Reserve - The Oaks at Yorkshire Reserve
- Johnstown Plan at Yorkshire Reserve - The Oaks at Yorkshire Reserve
- 7077 Meeker Commons Ln
- 3465 Turtle Shell Dr
- 6820 Brigantine Way
- 3361 Sea Turtle Dr
- 7475 Brantford Rd
- 7595 Meeker Rd
- 7612 Turtleback Dr
- 6810 Trailview Dr
- 2648 Little York Rd
- 2640 Little York Rd
- 7475 Silver Ln
- 2642 Little York Rd
- 2646 Little York Rd
- 2675 Little York Rd
- 2611 Little York Rd
- 2651 Little York Rd
- 2610 Little York Rd
- 2630 Little York Rd
- 2715 Little York Rd
- 2641 Little York Rd
- 2570 Little York Rd
- 2710 Little York Rd
- 7331 Silver Ln
- 2775 Little York Rd
- 2472 Arbor Glen Ct
- 2466 Arbor Glen Ct
- 2785 Little York Rd
- 2780 Little York Rd