Estimated Value: $202,845 - $239,000
3
Beds
3
Baths
1,092
Sq Ft
$200/Sq Ft
Est. Value
About This Home
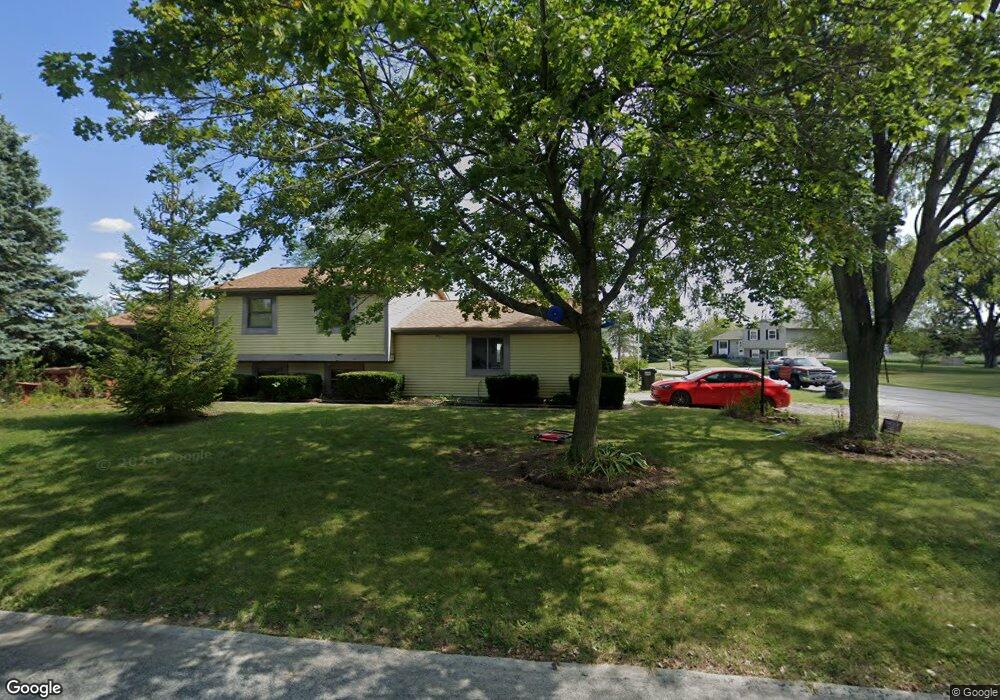
This home is located at 2680 River Bend Dr, Lima, OH 45807 and is currently estimated at $218,711, approximately $200 per square foot. 2680 River Bend Dr is a home located in Allen County with nearby schools including Elida Elementary School, Elida Middle School, and Elida High School.
Ownership History
Date
Name
Owned For
Owner Type
Purchase Details
Closed on
Mar 18, 2015
Sold by
Ralston Theodore S and Ralston Janis R
Bought by
Brinkman Shawn
Current Estimated Value
Home Financials for this Owner
Home Financials are based on the most recent Mortgage that was taken out on this home.
Original Mortgage
$90,333
Outstanding Balance
$70,292
Interest Rate
4.12%
Mortgage Type
FHA
Estimated Equity
$148,419
Purchase Details
Closed on
Jul 24, 2014
Sold by
Ralston Theodore E and Ralston Theodore
Bought by
Ralston Janis R
Purchase Details
Closed on
Apr 16, 1996
Sold by
Ralston Rosella
Bought by
Ralston Christine
Home Financials for this Owner
Home Financials are based on the most recent Mortgage that was taken out on this home.
Original Mortgage
$71,000
Interest Rate
7.46%
Mortgage Type
New Conventional
Purchase Details
Closed on
May 1, 1992
Bought by
Ralston Rosella J
Create a Home Valuation Report for This Property
The Home Valuation Report is an in-depth analysis detailing your home's value as well as a comparison with similar homes in the area
Purchase History
| Date | Buyer | Sale Price | Title Company |
|---|---|---|---|
| Brinkman Shawn | $92,500 | None Available | |
| Ralston Janis R | -- | None Available | |
| Ralston Christine | $73,200 | -- | |
| Ralston Rosella J | $68,000 | -- |
Source: Public Records
Mortgage History
| Date | Status | Borrower | Loan Amount |
|---|---|---|---|
| Open | Brinkman Shawn | $90,333 | |
| Previous Owner | Ralston Christine | $71,000 |
Source: Public Records
Tax History
| Year | Tax Paid | Tax Assessment Tax Assessment Total Assessment is a certain percentage of the fair market value that is determined by local assessors to be the total taxable value of land and additions on the property. | Land | Improvement |
|---|---|---|---|---|
| 2024 | $2,274 | $62,240 | $8,300 | $53,940 |
| 2023 | $1,717 | $44,460 | $5,920 | $38,540 |
| 2022 | $1,773 | $44,460 | $5,920 | $38,540 |
| 2021 | $1,782 | $44,460 | $5,920 | $38,540 |
| 2020 | $1,551 | $37,630 | $6,690 | $30,940 |
| 2019 | $1,551 | $37,630 | $6,690 | $30,940 |
| 2018 | $1,562 | $37,630 | $6,690 | $30,940 |
| 2017 | $1,362 | $34,830 | $6,690 | $28,140 |
| 2016 | $2,032 | $34,830 | $6,690 | $28,140 |
| 2015 | $2,397 | $34,830 | $6,690 | $28,140 |
| 2014 | $2,397 | $39,280 | $6,550 | $32,730 |
| 2013 | $2,138 | $39,280 | $6,550 | $32,730 |
Source: Public Records
Map
Nearby Homes
- 5126 Pheasant St
- 5280 Lobo St
- 5031 Daisy Ln
- 2877 Whippoorwill Ave
- 4864 Pheasant St
- 4910 Amaryllis St
- 4901 Lobo St
- 2105 Dutch Hollow Rd
- 5643 Clover Ridge Dr
- 1955 Dutch Hollow Rd
- 114 Roger St
- 5924 Timberstone Dr
- 2568 Susan Ann Dr
- 715 Wildwood Ave
- 0 Alix Dr
- 2561 Baty Rd
- 0000 Baty Rd
- 4250 Diller Rd
- 0000 Diller Rd
- 3055 Freyer Rd
- 5461 River Ridge St
- 2668 River Bend Dr
- 5464 River Trail
- 2681 River Bend Dr
- 5474 River Ridge St
- 5448 River Trail
- 2669 River Bend Dr
- 5486 River Ridge St
- 5462 River Ridge St
- 5498 River Ridge St
- 5450 River Ridge St
- 5432 River Trail
- 5431 River Ridge St
- 2657 River Bend Dr
- 5438 River Ridge St
- 2650 River Bend Dr
- 5416 River Trail
- 5461 River Trail
- 2677 River Grove Dr
Your Personal Tour Guide
Ask me questions while you tour the home.