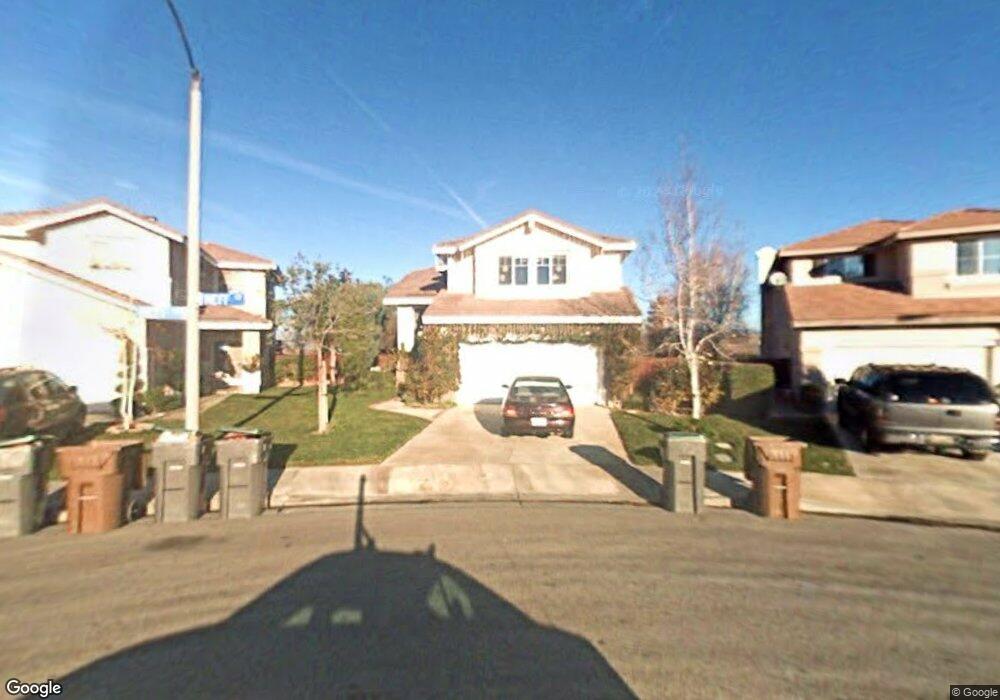
26805 Neff Ct Unit 23 Canyon Country, CA 91351
Estimated Value: $797,030 - $868,000
4
Beds
3
Baths
1,918
Sq Ft
$431/Sq Ft
Est. Value
About This Home
This home is located at 26805 Neff Ct Unit 23, Canyon Country, CA 91351 and is currently estimated at $826,677, approximately $431 per square foot. 26805 Neff Ct Unit 23 is a home located in Los Angeles County with nearby schools including Rio Vista Elementary School, La Mesa Junior High School, and Golden Valley High School.
Ownership History
Date
Name
Owned For
Owner Type
Purchase Details
Closed on
Aug 13, 2019
Sold by
Smith Rodney C and Smith Charron S
Bought by
Smith Rodney C and Smith Charron S
Current Estimated Value
Home Financials for this Owner
Home Financials are based on the most recent Mortgage that was taken out on this home.
Original Mortgage
$300,000
Outstanding Balance
$197,903
Interest Rate
3.7%
Mortgage Type
New Conventional
Estimated Equity
$628,774
Purchase Details
Closed on
Feb 26, 2014
Sold by
Smith Rodney C and Smith Charron S
Bought by
Smith Rodney C and Smith Charron S
Purchase Details
Closed on
Dec 4, 1998
Sold by
Pacific Bay Properties
Bought by
Smith Rodney C and Smith Charron S
Home Financials for this Owner
Home Financials are based on the most recent Mortgage that was taken out on this home.
Original Mortgage
$226,000
Interest Rate
6.78%
Create a Home Valuation Report for This Property
The Home Valuation Report is an in-depth analysis detailing your home's value as well as a comparison with similar homes in the area
Home Values in the Area
Average Home Value in this Area
Purchase History
| Date | Buyer | Sale Price | Title Company |
|---|---|---|---|
| Smith Rodney C | -- | Orange Coast Title Company | |
| Smith Rodney C | -- | None Available | |
| Smith Rodney C | $238,000 | Lawyers Title Company |
Source: Public Records
Mortgage History
| Date | Status | Borrower | Loan Amount |
|---|---|---|---|
| Open | Smith Rodney C | $300,000 | |
| Closed | Smith Rodney C | $226,000 |
Source: Public Records
Tax History Compared to Growth
Tax History
| Year | Tax Paid | Tax Assessment Tax Assessment Total Assessment is a certain percentage of the fair market value that is determined by local assessors to be the total taxable value of land and additions on the property. | Land | Improvement |
|---|---|---|---|---|
| 2025 | $5,328 | $374,459 | $141,082 | $233,377 |
| 2024 | $5,328 | $367,117 | $138,316 | $228,801 |
| 2023 | $5,091 | $359,919 | $135,604 | $224,315 |
| 2022 | $5,112 | $352,863 | $132,946 | $219,917 |
| 2021 | $5,024 | $345,945 | $130,340 | $215,605 |
| 2019 | $4,860 | $335,686 | $126,475 | $209,211 |
| 2018 | $4,689 | $329,105 | $123,996 | $205,109 |
| 2016 | $4,421 | $316,328 | $119,182 | $197,146 |
| 2015 | $4,258 | $311,577 | $117,392 | $194,185 |
| 2014 | $4,194 | $305,475 | $115,093 | $190,382 |
Source: Public Records
Map
Nearby Homes
- 20019 Nutcracker Ct
- 26506 Isabella Pkwy Unit 3
- 20342 Rue Crevier
- 20334 Rue Crevier Unit 622
- 20334 Rue Crevier Unit 620
- 26822 Pamela Dr
- 26961 Rainbow Glen Dr Unit 733
- 26750 Claudette St Unit 442
- 20306 Adriana Place
- 19852 Pandy Ct
- 20329 Rue Crevier Unit 546
- 20329 Rue Crevier
- 26966 Flo Ln Unit 317
- 26970 Flo Ln Unit 310
- 26926 Flo Ln Unit 422
- 26966 Flo Ln Unit 318
- 26853 Claudette St Unit 141
- 20344 Fanchon Ln Unit 132
- 19832 Pandy Ct
- 26964 Flo Ln Unit 324
- 26807 Neff Ct Unit 24
- 26803 Neff Ct Unit 22
- 26811 Neff Ct
- 26813 Neff Ct Unit 26
- 26745 Neff Ct
- 26741 Neff Ct
- 20305 Gray Ln
- 26808 Neff Ct Unit 38
- 26810 Neff Ct Unit 37
- 26812 Neff Ct
- 20303 Gray Ln Unit 40
- 26736 Neff Ct Unit 5
- 20301 Gray Ln
- 26814 Neff Ct
- 26725 Neff Ct
- 26820 Neff Ct
- 26822 Neff Ct
- 26824 Neff Ct Unit 30
- 26816 Neff Ct
- 26818 Neff Ct Unit 33