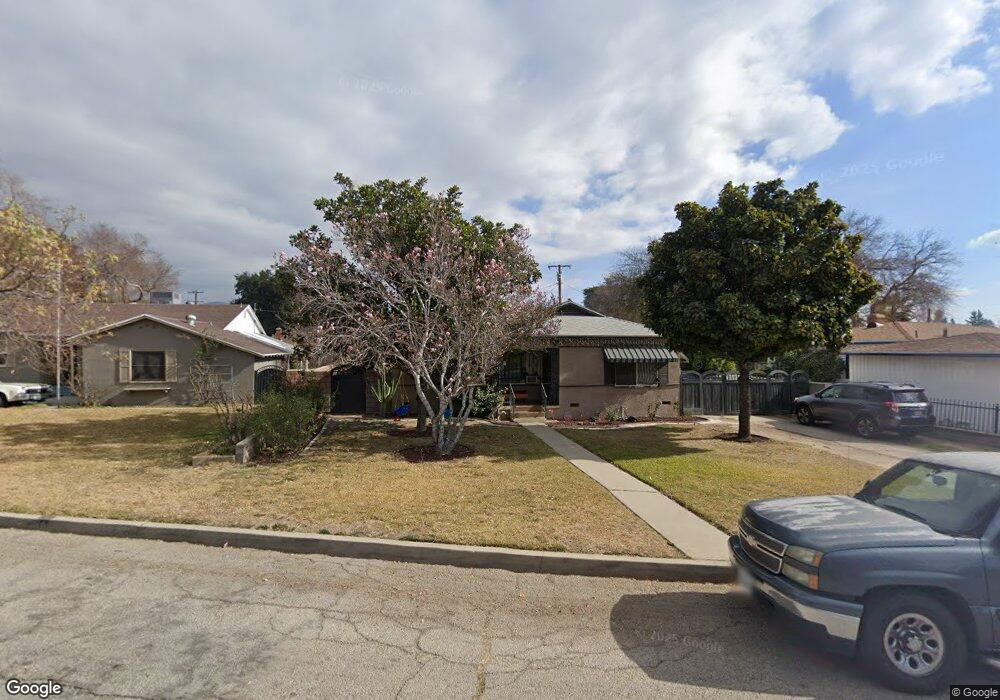
2681 Carlton St San Bernardino, CA 92405
Arrowview NeighborhoodEstimated Value: $430,000 - $470,000
3
Beds
1
Bath
1,104
Sq Ft
$414/Sq Ft
Est. Value
About This Home
This home is located at 2681 Carlton St, San Bernardino, CA 92405 and is currently estimated at $456,628, approximately $413 per square foot. 2681 Carlton St is a home located in San Bernardino County with nearby schools including George Brown Jr. Elementary, Arrowview Middle School, and San Bernardino High School.
Ownership History
Date
Name
Owned For
Owner Type
Purchase Details
Closed on
Sep 17, 2007
Sold by
Harris Lloyd E
Bought by
Ruvalcaba Angel and Ruvalcaba Edna
Current Estimated Value
Home Financials for this Owner
Home Financials are based on the most recent Mortgage that was taken out on this home.
Original Mortgage
$191,200
Outstanding Balance
$119,996
Interest Rate
6.4%
Mortgage Type
Purchase Money Mortgage
Estimated Equity
$336,632
Purchase Details
Closed on
Oct 22, 2002
Sold by
Graham Alice B Harris
Bought by
Graham Alice B
Create a Home Valuation Report for This Property
The Home Valuation Report is an in-depth analysis detailing your home's value as well as a comparison with similar homes in the area
Home Values in the Area
Average Home Value in this Area
Purchase History
| Date | Buyer | Sale Price | Title Company |
|---|---|---|---|
| Ruvalcaba Angel | $239,000 | Ticor Title Company | |
| Graham Alice B | -- | -- |
Source: Public Records
Mortgage History
| Date | Status | Borrower | Loan Amount |
|---|---|---|---|
| Open | Ruvalcaba Angel | $191,200 |
Source: Public Records
Tax History Compared to Growth
Tax History
| Year | Tax Paid | Tax Assessment Tax Assessment Total Assessment is a certain percentage of the fair market value that is determined by local assessors to be the total taxable value of land and additions on the property. | Land | Improvement |
|---|---|---|---|---|
| 2025 | $3,914 | $313,931 | $94,179 | $219,752 |
| 2024 | $3,914 | $307,775 | $92,332 | $215,443 |
| 2023 | $3,815 | $301,741 | $90,522 | $211,219 |
| 2022 | $3,820 | $295,824 | $88,747 | $207,077 |
| 2021 | $3,825 | $290,024 | $87,007 | $203,017 |
| 2020 | $3,568 | $266,700 | $80,300 | $186,400 |
| 2019 | $3,428 | $259,000 | $78,000 | $181,000 |
| 2018 | $2,695 | $200,900 | $59,800 | $141,100 |
| 2017 | $2,574 | $194,100 | $57,800 | $136,300 |
| 2016 | $2,381 | $181,400 | $54,000 | $127,400 |
| 2015 | $2,132 | $168,000 | $50,000 | $118,000 |
| 2014 | $1,997 | $159,000 | $48,000 | $111,000 |
Source: Public Records
Map
Nearby Homes