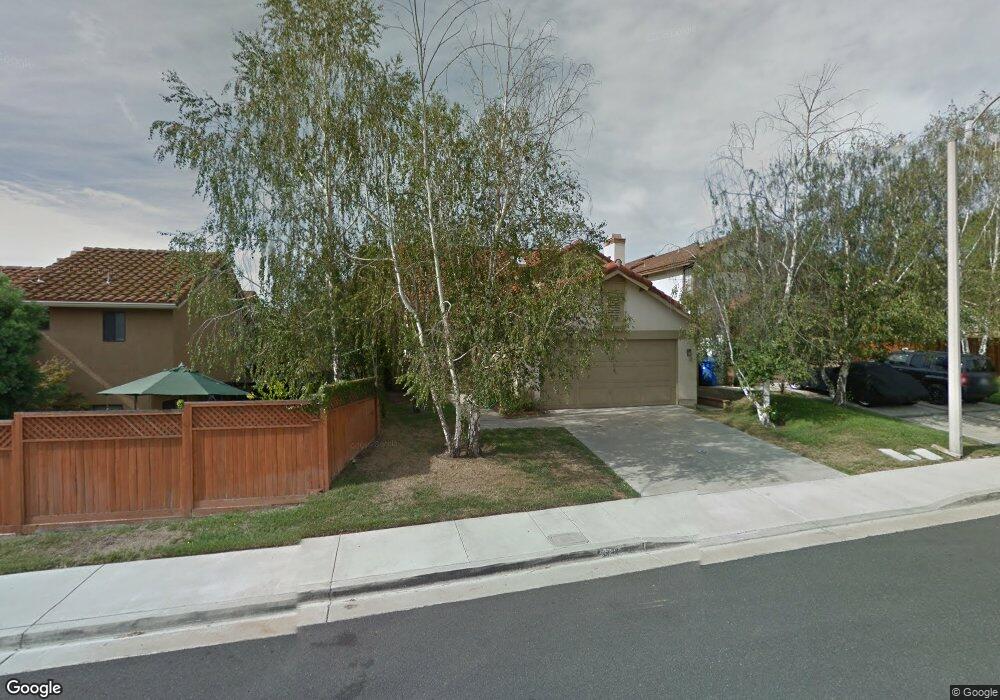
26810 Sage Ct Agoura Hills, CA 91301
Estimated Value: $1,222,000 - $1,412,000
4
Beds
3
Baths
2,048
Sq Ft
$645/Sq Ft
Est. Value
About This Home
This home is located at 26810 Sage Ct, Agoura Hills, CA 91301 and is currently estimated at $1,320,237, approximately $644 per square foot. 26810 Sage Ct is a home located in Los Angeles County with nearby schools including Lupin Hill Elementary, Arthur E. Wright Middle School, and Calabasas High School.
Ownership History
Date
Name
Owned For
Owner Type
Purchase Details
Closed on
Jan 30, 2003
Sold by
Zamel Sheila
Bought by
Zamel Sheila
Current Estimated Value
Home Financials for this Owner
Home Financials are based on the most recent Mortgage that was taken out on this home.
Original Mortgage
$322,700
Outstanding Balance
$136,994
Interest Rate
5.83%
Estimated Equity
$1,183,243
Purchase Details
Closed on
Oct 19, 1999
Sold by
Yarbrow Cathy G
Bought by
Zamel Sheila
Home Financials for this Owner
Home Financials are based on the most recent Mortgage that was taken out on this home.
Original Mortgage
$296,800
Interest Rate
3.45%
Purchase Details
Closed on
Oct 7, 1997
Sold by
Yarbrow Bradley W
Bought by
Yarbrow Cathy Grey
Purchase Details
Closed on
Apr 12, 1994
Sold by
Inciong Melchor
Bought by
Yarbrow Bradley W and Yarbrow Cathy Grey
Purchase Details
Closed on
Dec 13, 1993
Sold by
Santoni Anthony M
Bought by
Inciong Melchor
Create a Home Valuation Report for This Property
The Home Valuation Report is an in-depth analysis detailing your home's value as well as a comparison with similar homes in the area
Home Values in the Area
Average Home Value in this Area
Purchase History
| Date | Buyer | Sale Price | Title Company |
|---|---|---|---|
| Zamel Sheila | -- | United Title Company | |
| Zamel Sheila | $371,000 | Southland Title | |
| Yarbrow Cathy Grey | -- | -- | |
| Yarbrow Bradley W | $279,500 | First American Title Co | |
| Inciong Melchor | -- | First American Title Company |
Source: Public Records
Mortgage History
| Date | Status | Borrower | Loan Amount |
|---|---|---|---|
| Open | Zamel Sheila | $322,700 | |
| Closed | Zamel Sheila | $296,800 |
Source: Public Records
Tax History Compared to Growth
Tax History
| Year | Tax Paid | Tax Assessment Tax Assessment Total Assessment is a certain percentage of the fair market value that is determined by local assessors to be the total taxable value of land and additions on the property. | Land | Improvement |
|---|---|---|---|---|
| 2025 | $6,959 | $570,193 | $301,544 | $268,649 |
| 2024 | $6,959 | $559,014 | $295,632 | $263,382 |
| 2023 | $6,738 | $548,054 | $289,836 | $258,218 |
| 2022 | $6,530 | $537,308 | $284,153 | $253,155 |
| 2021 | $6,505 | $526,774 | $278,582 | $248,192 |
| 2019 | $6,279 | $511,152 | $270,320 | $240,832 |
| 2018 | $6,200 | $501,130 | $265,020 | $236,110 |
| 2016 | $5,877 | $481,673 | $254,730 | $226,943 |
| 2015 | $5,781 | $474,439 | $250,904 | $223,535 |
| 2014 | $5,708 | $465,147 | $245,990 | $219,157 |
Source: Public Records
Map
Nearby Homes
- 3966 Leighton Point Rd
- 4229 Via Mira Monte
- 26823 Hot Springs Place
- 4240 Lost Hills Rd Unit 503
- 4240 Lost Hills Rd Unit 1702
- 4240 Lost Hills Rd Unit 1902
- 4240 Lost Hills Rd Unit 3004
- 4201 Las Virgenes Rd Unit 112
- 4201 Las Virgenes Rd Unit 115
- 4201 Las Virgenes Rd Unit 220
- 4275 Las Virgenes Rd Unit 3
- 4322 Willow Glen St
- 27326 Oak Summit Rd
- 3936 United Rd
- 5021 Ambridge Dr
- 27311 Country Glen Rd
- 3952 Patrick Henry Place
- 27300 Agoura Rd
- 26950 Helmond Dr
- 27417 Park Vista Rd
- 26818 Sage Ct
- 3855 Lost Springs Dr
- 3859 Lost Springs Dr
- 3847 Lost Springs Dr
- 3812 Cottonwood Grove Trail
- 3818 Cottonwood Grove Trail
- 3830 Cottonwood Grove Trail
- 3836 Cottonwood Grove Trail
- 3843 Lost Springs Dr
- 3840 Cottonwood Grove Trail
- 3903 Lost Springs Dr
- 26811 Sage Ct
- 3846 Cottonwood Grove Trail
- 26817 Sage Ct
- 3907 Lost Springs Dr
- 3850 Cottonwood Grove Trail
- 3858 Lost Springs Dr
- 3854 Lost Springs Dr
- 3866 Lost Springs Dr
- 3848 Lost Springs Dr