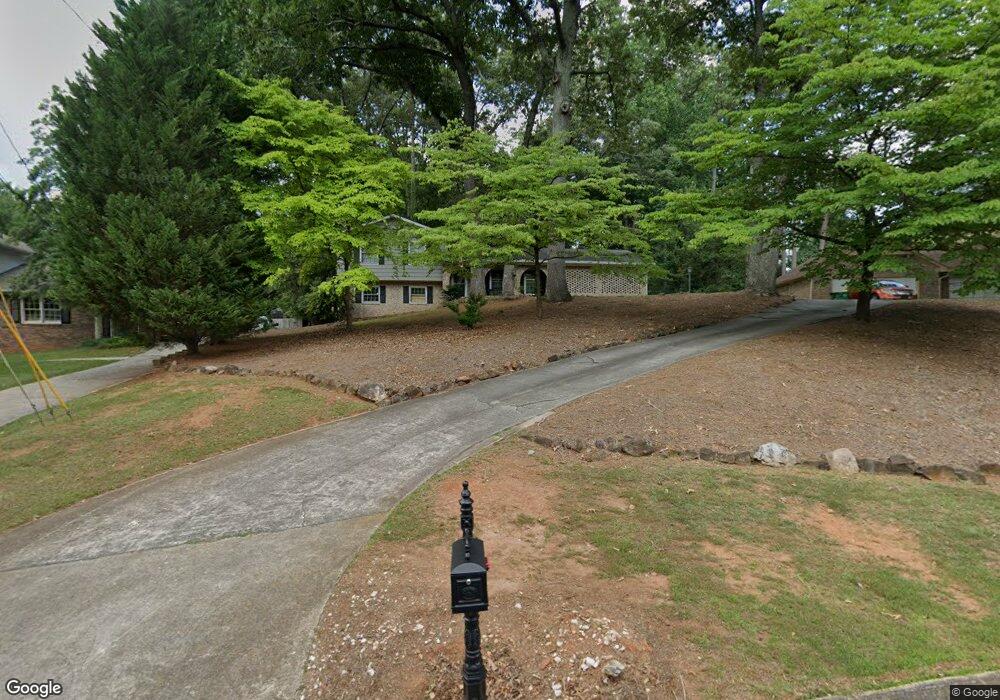
2682 Lee Ann Dr Marietta, GA 30066
Sandy Plains NeighborhoodEstimated Value: $394,000 - $438,000
4
Beds
2
Baths
2,030
Sq Ft
$208/Sq Ft
Est. Value
About This Home
This home is located at 2682 Lee Ann Dr, Marietta, GA 30066 and is currently estimated at $422,170, approximately $207 per square foot. 2682 Lee Ann Dr is a home located in Cobb County with nearby schools including Bells Ferry Elementary School, Daniell Middle School, and Sprayberry High School.
Ownership History
Date
Name
Owned For
Owner Type
Purchase Details
Closed on
Jun 28, 2016
Sold by
King Breck R
Bought by
King Kyle
Current Estimated Value
Home Financials for this Owner
Home Financials are based on the most recent Mortgage that was taken out on this home.
Original Mortgage
$195,461
Outstanding Balance
$156,886
Interest Rate
3.75%
Mortgage Type
FHA
Estimated Equity
$265,284
Purchase Details
Closed on
Nov 9, 2009
Sold by
King Breck R and King Kyle
Bought by
King Breck R and King Kyle
Home Financials for this Owner
Home Financials are based on the most recent Mortgage that was taken out on this home.
Original Mortgage
$186,558
Interest Rate
5.15%
Mortgage Type
FHA
Purchase Details
Closed on
Sep 14, 2009
Sold by
Nau Jeremy P
Bought by
Beasley Breck and King Kyle
Home Financials for this Owner
Home Financials are based on the most recent Mortgage that was taken out on this home.
Original Mortgage
$186,558
Interest Rate
5.15%
Mortgage Type
FHA
Purchase Details
Closed on
Jan 27, 2005
Sold by
Pressell James L and Pressell Louann
Bought by
Nau Jeremy P
Home Financials for this Owner
Home Financials are based on the most recent Mortgage that was taken out on this home.
Original Mortgage
$144,800
Interest Rate
5.69%
Mortgage Type
New Conventional
Create a Home Valuation Report for This Property
The Home Valuation Report is an in-depth analysis detailing your home's value as well as a comparison with similar homes in the area
Home Values in the Area
Average Home Value in this Area
Purchase History
| Date | Buyer | Sale Price | Title Company |
|---|---|---|---|
| King Kyle | $195,461 | -- | |
| King Breck R | -- | -- | |
| Beasley Breck | $190,000 | -- | |
| Nau Jeremy P | $181,000 | -- |
Source: Public Records
Mortgage History
| Date | Status | Borrower | Loan Amount |
|---|---|---|---|
| Open | King Kyle | $195,461 | |
| Previous Owner | Beasley Breck | $186,558 | |
| Previous Owner | Nau Jeremy P | $144,800 |
Source: Public Records
Tax History Compared to Growth
Tax History
| Year | Tax Paid | Tax Assessment Tax Assessment Total Assessment is a certain percentage of the fair market value that is determined by local assessors to be the total taxable value of land and additions on the property. | Land | Improvement |
|---|---|---|---|---|
| 2024 | $3,271 | $135,224 | $34,000 | $101,224 |
| 2023 | $2,959 | $145,844 | $28,000 | $117,844 |
| 2022 | $2,528 | $100,128 | $24,000 | $76,128 |
| 2021 | $2,528 | $100,128 | $24,000 | $76,128 |
| 2020 | $2,400 | $94,268 | $17,600 | $76,668 |
| 2019 | $2,239 | $86,932 | $17,600 | $69,332 |
| 2018 | $2,239 | $86,932 | $17,600 | $69,332 |
| 2017 | $1,474 | $60,192 | $17,600 | $42,592 |
| 2016 | $1,475 | $60,192 | $17,600 | $42,592 |
| 2015 | $1,615 | $63,640 | $10,000 | $53,640 |
| 2014 | $1,073 | $44,952 | $0 | $0 |
Source: Public Records
Map
Nearby Homes
- 2789 Cottonwood Dr
- 2659 Bethel Ct
- 106 Vintage Club Cir Unit 2
- 2712 Vintage Reserve Ln Unit 22
- 144 Vintage Club Cir Unit 26
- 2765 Prado Ln
- 336 Rockmoor Trail
- 2741 Prado Ln
- 52 Lathhouse Ln
- 159 Kendrick Farm Ln Unit 15
- 2850 Seagrave Way
- 159 Lloyd Dr
- 2391 Black Oak Dr
- 2388 Black Oak Dr
- 3171 Vickery Dr NE
- 3157 Bellestone Ct
- 2676 Lee Ann Dr
- 2676 Lee Ann Dr Unit 2676
- 2770 Cedarbrook Dr
- 2782 Cedarbrook Dr Unit 3
- 522 Chapman Ln
- 2670 Lee Ann Dr
- 520 Chapman Ln
- 2685 Lee Ann Dr
- 526 Chapman Ln
- 2679 Lee Ann Dr
- 0 Cedarbrook Dr Unit 7510232
- 0 Cedarbrook Dr Unit 8815617
- 0 Cedarbrook Dr Unit 8810396
- 0 Cedarbrook Dr Unit 8733017
- 0 Cedarbrook Dr Unit 8419039
- 0 Cedarbrook Dr Unit 7586825
- 2666 Lee Ann Dr
- 518 Chapman Ln
- 2730 Cedarbrook Dr
- 2794 Cedarbrook Dr