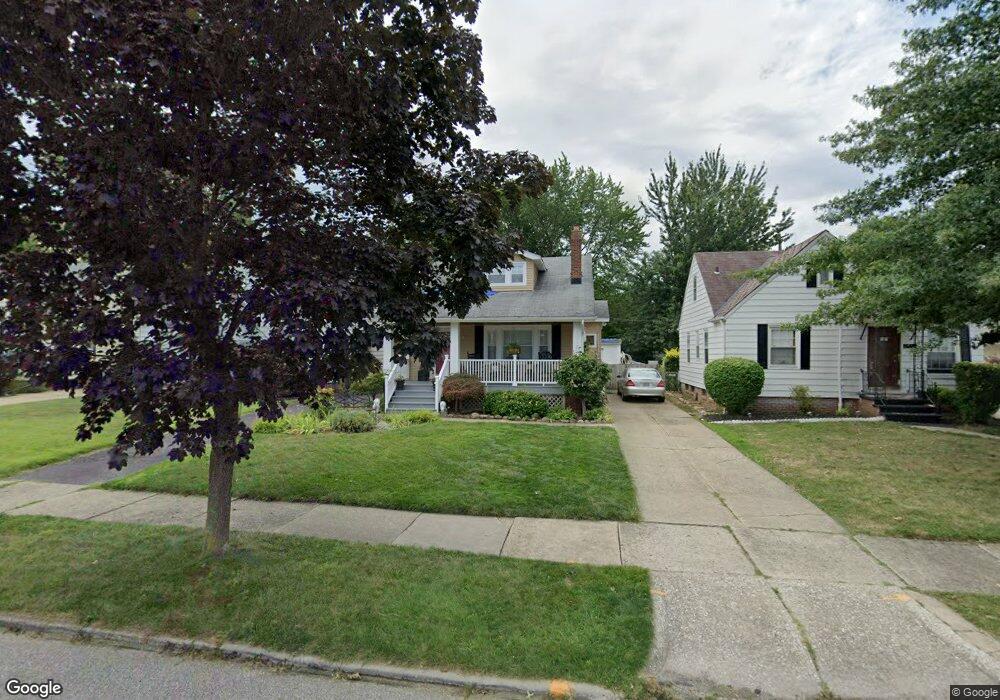
26830 Mallard Ave Euclid, OH 44132
Estimated Value: $141,000 - $159,000
4
Beds
2
Baths
1,443
Sq Ft
$105/Sq Ft
Est. Value
About This Home
This home is located at 26830 Mallard Ave, Euclid, OH 44132 and is currently estimated at $150,872, approximately $104 per square foot. 26830 Mallard Ave is a home located in Cuyahoga County with nearby schools including Shoreview Elementary School, Euclid High School, and Mater Dei Academy.
Ownership History
Date
Name
Owned For
Owner Type
Purchase Details
Closed on
Jun 26, 2003
Sold by
Hunter Sally A and Hunter Jeffrey
Bought by
Klinger Kevin
Current Estimated Value
Home Financials for this Owner
Home Financials are based on the most recent Mortgage that was taken out on this home.
Original Mortgage
$98,800
Outstanding Balance
$48,145
Interest Rate
8%
Mortgage Type
Purchase Money Mortgage
Estimated Equity
$102,727
Purchase Details
Closed on
Aug 8, 1994
Sold by
Loos Brett
Bought by
Quinlivan Sally A
Home Financials for this Owner
Home Financials are based on the most recent Mortgage that was taken out on this home.
Original Mortgage
$72,900
Interest Rate
8.53%
Mortgage Type
New Conventional
Purchase Details
Closed on
Apr 26, 1991
Sold by
Boyden Gerald E and Boyden Nancy J
Bought by
Loos Brett
Purchase Details
Closed on
Jan 1, 1975
Bought by
Boyden Gerald E and Boyden Nancy J
Create a Home Valuation Report for This Property
The Home Valuation Report is an in-depth analysis detailing your home's value as well as a comparison with similar homes in the area
Home Values in the Area
Average Home Value in this Area
Purchase History
| Date | Buyer | Sale Price | Title Company |
|---|---|---|---|
| Klinger Kevin | $104,000 | Mountaineer Title Inc | |
| Quinlivan Sally A | $81,000 | -- | |
| Loos Brett | $55,500 | -- | |
| Boyden Gerald E | -- | -- |
Source: Public Records
Mortgage History
| Date | Status | Borrower | Loan Amount |
|---|---|---|---|
| Open | Klinger Kevin | $98,800 | |
| Previous Owner | Quinlivan Sally A | $72,900 |
Source: Public Records
Tax History
| Year | Tax Paid | Tax Assessment Tax Assessment Total Assessment is a certain percentage of the fair market value that is determined by local assessors to be the total taxable value of land and additions on the property. | Land | Improvement |
|---|---|---|---|---|
| 2025 | $3,155 | $47,355 | $8,330 | $39,025 |
| 2024 | $3,256 | $47,355 | $8,330 | $39,025 |
| 2023 | $2,814 | $32,490 | $6,340 | $26,150 |
| 2022 | $2,750 | $32,480 | $6,335 | $26,145 |
| 2021 | $3,063 | $32,480 | $6,340 | $26,150 |
| 2020 | $2,904 | $28,000 | $5,460 | $22,540 |
| 2019 | $2,611 | $80,000 | $15,600 | $64,400 |
| 2018 | $2,590 | $28,000 | $5,460 | $22,540 |
| 2017 | $2,799 | $24,860 | $4,520 | $20,340 |
| 2016 | $2,806 | $24,470 | $4,520 | $19,950 |
| 2015 | $2,516 | $24,470 | $4,520 | $19,950 |
| 2014 | $2,516 | $24,470 | $4,520 | $19,950 |
Source: Public Records
Map
Nearby Homes
- 26831 Shoreview Ave
- 610 E 266th St
- 26530 Shoreview Ave
- 440 E 271st St
- 563 E 260th St
- 568 Sycamore Dr
- 411 E 270th St
- 571 E 260th St
- 597 Hemlock Dr
- 643 E 261st St
- 670 Hemlock Dr
- 754 Hemlock Dr
- 25731 Zeman Ave
- 730 Hemlock Dr
- 355 E 257th St
- 325 E 264th St
- 26361 Elinore Ave
- 25671 Farringdon Ave
- 325 E 257th St
- 428 E 274th St
- 26850 Mallard Ave
- 26800 Mallard Ave
- 26870 Mallard Ave
- 26890 Mallard Ave
- 571 E 266th St
- 575 E 266th St
- 565 E 266th St
- 581 E 266th St
- 26841 Shoreview Ave
- 26801 Shoreview Ave
- 26900 Mallard Ave
- 26871 Shoreview Ave
- 585 E 266th St
- 26831 Mallard Ave
- 26891 Shoreview Ave
- 555 E 266th St
- 26801 Mallard Ave
- 26841 Mallard Ave
- 591 E 266th St
- 26930 Mallard Ave
Your Personal Tour Guide
Ask me questions while you tour the home.