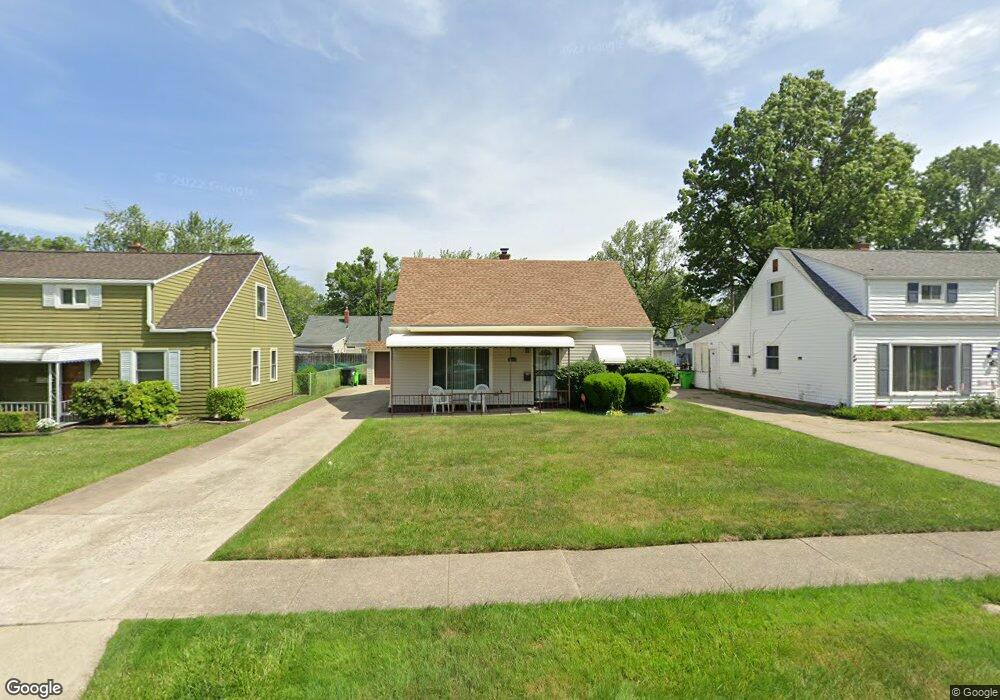
26831 Shirley Ave Euclid, OH 44132
Estimated Value: $115,461 - $170,000
3
Beds
1
Bath
1,039
Sq Ft
$133/Sq Ft
Est. Value
About This Home
This home is located at 26831 Shirley Ave, Euclid, OH 44132 and is currently estimated at $138,615, approximately $133 per square foot. 26831 Shirley Ave is a home located in Cuyahoga County with nearby schools including Shoreview Elementary School, Euclid High School, and Ss. Robert & William Catholic School.
Ownership History
Date
Name
Owned For
Owner Type
Purchase Details
Closed on
Feb 24, 2006
Sold by
Geosano Robert A and Geosano Mary E
Bought by
Roberts Helen L
Current Estimated Value
Home Financials for this Owner
Home Financials are based on the most recent Mortgage that was taken out on this home.
Original Mortgage
$85,500
Interest Rate
6.2%
Mortgage Type
Fannie Mae Freddie Mac
Purchase Details
Closed on
Dec 6, 1983
Sold by
Geosano Robert A
Bought by
Geosano Robert A and Geosano Mary E
Purchase Details
Closed on
Oct 24, 1980
Sold by
Potichny Stefanie
Bought by
Geosano Robert A
Purchase Details
Closed on
May 22, 1979
Sold by
Potichny John and Potichny Stefanie
Bought by
Potichny Stefanie
Purchase Details
Closed on
Mar 5, 1979
Sold by
Kaim James V
Bought by
Potichny John and Potichny Stefanie
Purchase Details
Closed on
Jan 1, 1975
Bought by
Kaim James
Create a Home Valuation Report for This Property
The Home Valuation Report is an in-depth analysis detailing your home's value as well as a comparison with similar homes in the area
Home Values in the Area
Average Home Value in this Area
Purchase History
| Date | Buyer | Sale Price | Title Company |
|---|---|---|---|
| Roberts Helen L | $90,000 | Reliance Title Agency | |
| Geosano Robert A | -- | -- | |
| Geosano Robert A | $43,000 | -- | |
| Potichny Stefanie | -- | -- | |
| Potichny John | $45,000 | -- | |
| Kaim James | -- | -- |
Source: Public Records
Mortgage History
| Date | Status | Borrower | Loan Amount |
|---|---|---|---|
| Previous Owner | Roberts Helen L | $85,500 |
Source: Public Records
Tax History Compared to Growth
Tax History
| Year | Tax Paid | Tax Assessment Tax Assessment Total Assessment is a certain percentage of the fair market value that is determined by local assessors to be the total taxable value of land and additions on the property. | Land | Improvement |
|---|---|---|---|---|
| 2024 | $1,998 | $38,990 | $8,435 | $30,555 |
| 2023 | $1,603 | $27,690 | $6,370 | $21,320 |
| 2022 | $2,364 | $27,690 | $6,370 | $21,320 |
| 2021 | $2,630 | $27,690 | $6,370 | $21,320 |
| 2020 | $2,496 | $23,870 | $5,500 | $18,380 |
| 2019 | $2,243 | $68,200 | $15,700 | $52,500 |
| 2018 | $2,249 | $23,870 | $5,500 | $18,380 |
| 2017 | $2,420 | $21,350 | $4,550 | $16,800 |
| 2016 | $2,425 | $21,350 | $4,550 | $16,800 |
| 2015 | $2,209 | $21,350 | $4,550 | $16,800 |
| 2014 | $2,209 | $21,350 | $4,550 | $16,800 |
Source: Public Records
Map
Nearby Homes
- 26951 Shirley Ave
- 26430 Drakefield Ave
- 26351 Farringdon Ave
- 780 E 266th St
- 26471 Shoreview Ave
- 571 E 260th St
- 26581 Oriole Ave
- 650 E 260th St
- 26481 Oriole Ave
- 26230 Oriole Ave
- 591 Hemlock Dr
- 550 Sycamore Dr
- 25751 Briardale Ave
- 26201 Oriole Ave
- 25731 Zeman Ave
- 25700 Briardale Ave
- 440 E 271st St
- 25401 Farringdon Ave
- 411 E 270th St
- 416 E 255th St
- 26851 Shirley Ave
- 26801 Shirley Ave
- 26871 Shirley Ave
- 26830 Farringdon Ave
- 685 E 266th St
- 26800 Farringdon Ave
- 26850 Farringdon Ave
- 681 E 266th St
- 26891 Shirley Ave
- 26870 Farringdon Ave
- 695 E 266th St
- 675 E 266th St
- 26830 Shirley Ave
- 26850 Shirley Ave
- 26890 Farringdon Ave
- 671 E 266th St
- 26870 Shirley Ave
- 701 E 266th St
- 26901 Shirley Ave
- 26890 Shirley Ave