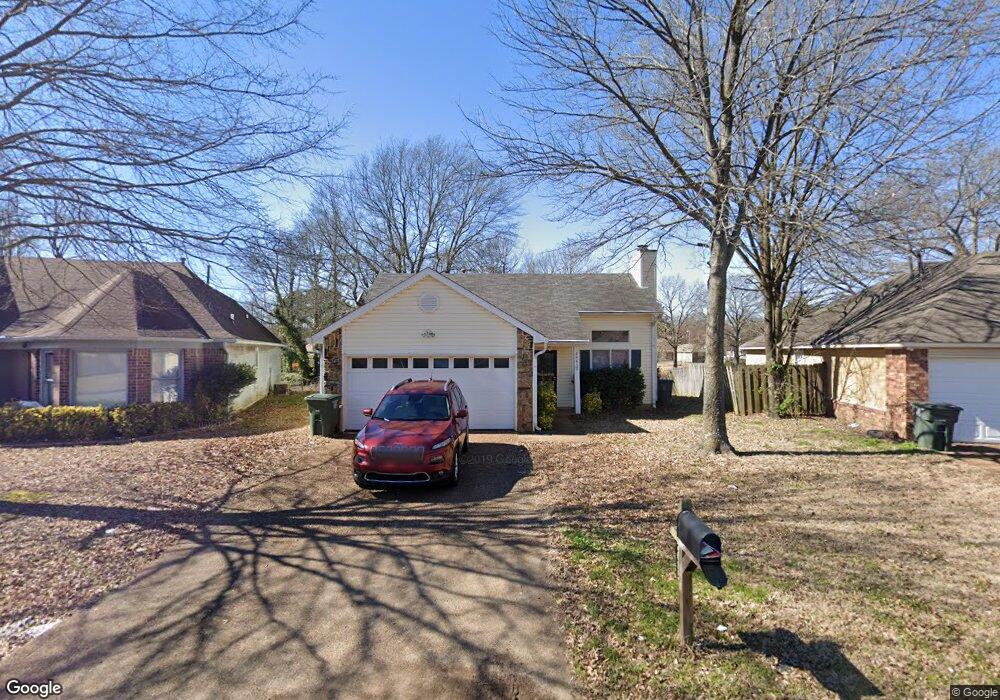
2685 Bay Pointe Cir N Memphis, TN 38128
Raleigh NeighborhoodEstimated Value: $175,000 - $187,000
3
Beds
2
Baths
1,158
Sq Ft
$155/Sq Ft
Est. Value
About This Home
This home is located at 2685 Bay Pointe Cir N, Memphis, TN 38128 and is currently estimated at $179,786, approximately $155 per square foot. 2685 Bay Pointe Cir N is a home located in Shelby County with nearby schools including Raleigh-Bartlett Meadows School, Craigmont Middle School, and Craigmont High School.
Ownership History
Date
Name
Owned For
Owner Type
Purchase Details
Closed on
Apr 28, 2011
Sold by
Smith Sherika J
Bought by
Fort Knox Properties Llc
Current Estimated Value
Purchase Details
Closed on
Nov 13, 2006
Sold by
Smith Charles J and Smith Donna R
Bought by
Smith Sherika J
Home Financials for this Owner
Home Financials are based on the most recent Mortgage that was taken out on this home.
Original Mortgage
$91,675
Interest Rate
10.35%
Mortgage Type
Purchase Money Mortgage
Purchase Details
Closed on
Aug 28, 1997
Sold by
Barrow Jon T
Bought by
Smith Charles J and Smith Donna R
Home Financials for this Owner
Home Financials are based on the most recent Mortgage that was taken out on this home.
Original Mortgage
$83,947
Interest Rate
7.43%
Mortgage Type
FHA
Purchase Details
Closed on
Jun 29, 1995
Bought by
Barrow Jon T
Create a Home Valuation Report for This Property
The Home Valuation Report is an in-depth analysis detailing your home's value as well as a comparison with similar homes in the area
Home Values in the Area
Average Home Value in this Area
Purchase History
| Date | Buyer | Sale Price | Title Company |
|---|---|---|---|
| Fort Knox Properties Llc | $40,906 | None Available | |
| Smith Sherika J | $96,500 | None Available | |
| Smith Charles J | $83,000 | -- | |
| Smith Charles J | $83,000 | -- | |
| Barrow Jon T | $74,900 | -- |
Source: Public Records
Mortgage History
| Date | Status | Borrower | Loan Amount |
|---|---|---|---|
| Previous Owner | Smith Sherika J | $91,675 | |
| Previous Owner | Smith Charles J | $83,947 |
Source: Public Records
Tax History
| Year | Tax Paid | Tax Assessment Tax Assessment Total Assessment is a certain percentage of the fair market value that is determined by local assessors to be the total taxable value of land and additions on the property. | Land | Improvement |
|---|---|---|---|---|
| 2025 | $775 | $39,675 | $5,750 | $33,925 |
| 2024 | $775 | $22,850 | $4,550 | $18,300 |
| 2023 | $1,392 | $22,850 | $4,550 | $18,300 |
| 2022 | $1,392 | $22,850 | $4,550 | $18,300 |
| 2021 | $1,408 | $22,850 | $4,550 | $18,300 |
| 2020 | $1,379 | $19,025 | $4,550 | $14,475 |
| 2019 | $1,379 | $19,025 | $4,550 | $14,475 |
| 2018 | $1,379 | $19,025 | $4,550 | $14,475 |
| 2017 | $782 | $19,025 | $4,550 | $14,475 |
| 2016 | $545 | $12,475 | $0 | $0 |
| 2014 | $545 | $15,350 | $0 | $0 |
Source: Public Records
Map
Nearby Homes
- 2725 Covington Pike
- 2783 E Battle Creek Cove
- 4757 Northfield Cir
- 2573 Courtney Dr
- 00 Raleigh Lagrange Rd
- 4689 Raleigh Lagrange Rd
- 2830 Suesand Dr
- 2784 Chiswood St
- 2739 Lynchburg St
- 2568 Parkview Dr
- 2888 Clearwood Rd
- 4850 Stage Rd
- 5197 Kimbark Woods Dr
- 0 Stage Rd Unit 10201799
- 0 Coleman Rd
- 3002 Robbiedon St
- 5210 Wax Wing Ln
- 4564 Stage Rd
- 4719 Casann Ave
- 5364 Virgil Rd
- 2689 Bay Pointe Cir N
- 2681 Bay Pointe Cir N
- 2693 Bay Pointe Cir N
- 2677 Bay Pointe Cir N
- 2684 Bay Pointe Cir N
- 2697 Bay Pointe Cir N
- 2692 Bay Pointe Cir N
- 2673 Bay Pointe Cir W
- 4926 Chamberlain Ln
- 2696 Bay Pointe Cir N
- 2701 Bay Pointe Cir N
- 4932 Chamberlain Ln
- 2696 Battle Creek Dr
- 2669 Bay Pointe Cir W
- 2692 Battle Creek Dr
- 4936 Chamberlain Ln
- 2700 Battle Creek Dr
- 2686 Battle Creek Dr
- 2680 Battle Creek Dr
- 2700 Bay Pointe Cir N