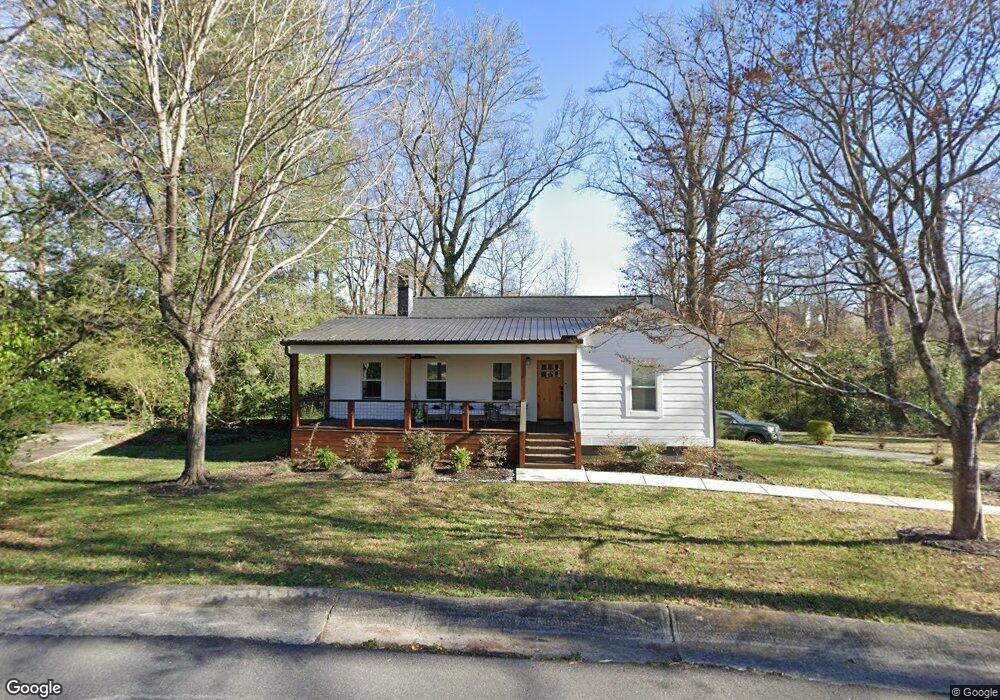
2685 Brown Cir SE Smyrna, GA 30080
Estimated Value: $471,000 - $609,000
3
Beds
2
Baths
1,342
Sq Ft
$406/Sq Ft
Est. Value
About This Home
This home is located at 2685 Brown Cir SE, Smyrna, GA 30080 and is currently estimated at $544,899, approximately $406 per square foot. 2685 Brown Cir SE is a home located in Cobb County with nearby schools including Smyrna Elementary School, Campbell Middle School, and Campbell High School.
Ownership History
Date
Name
Owned For
Owner Type
Purchase Details
Closed on
Mar 26, 2021
Sold by
Mackinder James C and Mackinder Kay F
Bought by
Mackinder Sean H and Mackinder Jessica L
Current Estimated Value
Home Financials for this Owner
Home Financials are based on the most recent Mortgage that was taken out on this home.
Original Mortgage
$329,000
Outstanding Balance
$296,645
Interest Rate
3.05%
Mortgage Type
New Conventional
Estimated Equity
$248,254
Purchase Details
Closed on
Jan 22, 2019
Sold by
Mackinder James C
Bought by
Mackinder James C and Mackinder Kay F
Purchase Details
Closed on
Jul 27, 2012
Sold by
Hamilton Marilynn Mackinde
Bought by
Mackinder James C
Purchase Details
Closed on
Jun 15, 2010
Sold by
Mackinder Martha E C
Bought by
Mackinder Martha E C
Create a Home Valuation Report for This Property
The Home Valuation Report is an in-depth analysis detailing your home's value as well as a comparison with similar homes in the area
Home Values in the Area
Average Home Value in this Area
Purchase History
| Date | Buyer | Sale Price | Title Company |
|---|---|---|---|
| Mackinder Sean H | -- | None Available | |
| Mackinder James C | -- | -- | |
| Mackinder James C | -- | -- | |
| Mackinder James C | -- | -- | |
| Mackinder Martha E C | -- | -- |
Source: Public Records
Mortgage History
| Date | Status | Borrower | Loan Amount |
|---|---|---|---|
| Open | Mackinder Sean H | $329,000 |
Source: Public Records
Tax History Compared to Growth
Tax History
| Year | Tax Paid | Tax Assessment Tax Assessment Total Assessment is a certain percentage of the fair market value that is determined by local assessors to be the total taxable value of land and additions on the property. | Land | Improvement |
|---|---|---|---|---|
| 2025 | $3,658 | $176,108 | $132,480 | $43,628 |
| 2024 | $3,658 | $176,108 | $132,480 | $43,628 |
| 2023 | $2,854 | $159,224 | $119,232 | $39,992 |
| 2022 | $2,762 | $126,932 | $88,320 | $38,612 |
| 2021 | $2,409 | $107,500 | $79,488 | $28,012 |
| 2020 | $1,905 | $81,004 | $52,992 | $28,012 |
| 2019 | $2,069 | $75,252 | $52,992 | $22,260 |
| 2018 | $1,396 | $50,776 | $30,912 | $19,864 |
| 2017 | $1,310 | $50,776 | $30,912 | $19,864 |
| 2016 | $1,170 | $45,368 | $26,496 | $18,872 |
| 2015 | $924 | $34,992 | $12,880 | $22,112 |
| 2014 | $933 | $34,992 | $0 | $0 |
Source: Public Records
Map
Nearby Homes
- 2685 Grady St SE
- 1055 Powder Springs St SE
- 1180 Fleming St SE
- 2771 Guthrie St SE
- 1222 Poston Place SE
- 1211 Stephens St SE
- 3061 Devoncroft St
- 332 Symphony Way
- 204 Dellwood Dr SE
- 1201 Church St SE
- 228 Dellwood Dr SE
- 3005 Devoncroft St SE
- 1202 Madison Ln SE
- 164 Blakemore Dr SE
- 1307 Madison Ln SE
- 704 Madison Ln SE
- 603 Madison Ln SE
- 1058 Kirkland Cir
- 403 Madison Ln SE
- 1071 Church St SE
- 2667 Brown Cir SE
- 2695 Brown Cir SE
- 2668 Brown Cir SE
- 2699 Brown Cir SE
- 2651 Brown Cir SE
- 2679 Hughes St SE
- 2648 Brown Cir SE
- 1171 Powder Springs St SE
- 0 Brown Cir SE Unit 7118609
- 0 Brown Cir SE Unit 8160692
- 1159 Powder Springs St SE
- 2705 Brown Cir SE
- 2669 Hughes St SE
- 1189 Powder Springs St SE
- 2641 Brown Cir SE
- 2707 Hughes St SE
- 2659 Hughes St SE
- 1191 Powder Springs St SE
- 2662 Hickory Hill Dr SE
- 2638 Brown Cir SE