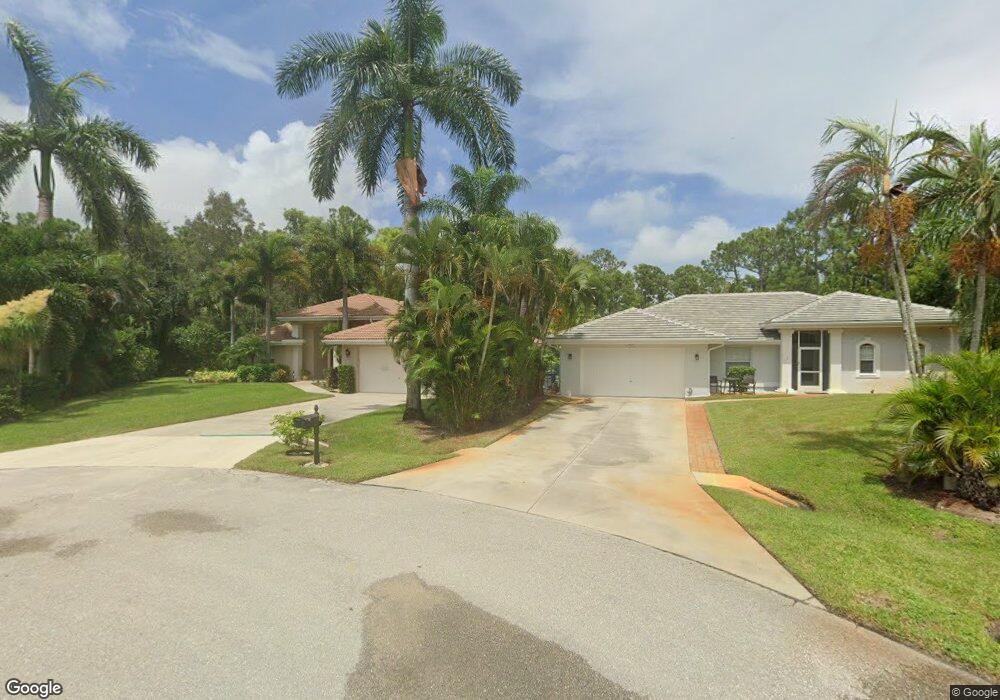
26851 Nicki J Ct Bonita Springs, FL 34135
Central Bonita Springs NeighborhoodEstimated Value: $532,689 - $664,000
3
Beds
2
Baths
1,938
Sq Ft
$303/Sq Ft
Est. Value
About This Home
This home is located at 26851 Nicki J Ct, Bonita Springs, FL 34135 and is currently estimated at $588,172, approximately $303 per square foot. 26851 Nicki J Ct is a home located in Lee County with nearby schools including Bonita Springs Elementary School, Spring Creek Elementary School, and Pinewoods Elementary School.
Ownership History
Date
Name
Owned For
Owner Type
Purchase Details
Closed on
Aug 27, 2010
Sold by
Pwr Property Llc
Bought by
Damico Joseph and Damico Susan
Current Estimated Value
Purchase Details
Closed on
May 21, 2010
Sold by
Vanderbilt Properties Llc
Bought by
Pwr Property Llc
Purchase Details
Closed on
Jul 5, 2005
Sold by
Gardner Eldon J and Gardner Theresa
Bought by
Johnson Teri L
Home Financials for this Owner
Home Financials are based on the most recent Mortgage that was taken out on this home.
Original Mortgage
$319,200
Interest Rate
5.75%
Mortgage Type
Unknown
Purchase Details
Closed on
Apr 16, 2001
Sold by
Rebmann Claus and Rebmann Heidi
Bought by
Gardner Eldon J and Gardner Theresa
Home Financials for this Owner
Home Financials are based on the most recent Mortgage that was taken out on this home.
Original Mortgage
$185,000
Interest Rate
6.99%
Create a Home Valuation Report for This Property
The Home Valuation Report is an in-depth analysis detailing your home's value as well as a comparison with similar homes in the area
Home Values in the Area
Average Home Value in this Area
Purchase History
| Date | Buyer | Sale Price | Title Company |
|---|---|---|---|
| Damico Joseph | $239,900 | Bonita Title Inc | |
| Pwr Property Llc | $149,000 | Safe Harbor Title Company | |
| Vanderbilt Properties Llc | $125,000 | Safe Harbor Title | |
| Johnson Teri L | $399,000 | -- | |
| Gardner Eldon J | $205,000 | -- |
Source: Public Records
Mortgage History
| Date | Status | Borrower | Loan Amount |
|---|---|---|---|
| Previous Owner | Johnson Teri L | $319,200 | |
| Previous Owner | Gardner Eldon J | $185,000 |
Source: Public Records
Tax History Compared to Growth
Tax History
| Year | Tax Paid | Tax Assessment Tax Assessment Total Assessment is a certain percentage of the fair market value that is determined by local assessors to be the total taxable value of land and additions on the property. | Land | Improvement |
|---|---|---|---|---|
| 2025 | $5,801 | $426,031 | $77,520 | $309,008 |
| 2024 | $5,683 | $391,285 | -- | -- |
| 2023 | $5,683 | $355,714 | $0 | $0 |
| 2022 | $4,888 | $323,376 | $0 | $0 |
| 2021 | $4,336 | $293,978 | $58,555 | $235,423 |
| 2020 | $4,204 | $276,156 | $57,465 | $218,691 |
| 2019 | $4,256 | $278,599 | $55,000 | $223,599 |
| 2018 | $4,089 | $278,603 | $55,000 | $223,603 |
| 2017 | $3,874 | $259,216 | $43,750 | $215,466 |
| 2016 | $4,016 | $294,856 | $43,750 | $251,106 |
| 2015 | $3,191 | $189,412 | $40,900 | $148,512 |
| 2014 | $2,999 | $178,113 | $30,000 | $148,113 |
| 2013 | -- | $158,886 | $22,500 | $136,386 |
Source: Public Records
Map
Nearby Homes
- 26974 Wildwood Pines Ln
- 26982 Wildwood Pines Ln
- 11499 Forest Mere Dr
- 26586 Southern Pines Dr Unit 101
- 11610 Red Hibiscus Dr
- 11568 Forest Mere Dr
- 27120 Pinecrest Ln
- 11817 Forest Mere Dr
- 27288 Bourbonniere Dr
- 11761 Forest Mere Dr
- 11658 Forest Mere Dr
- 11758 S Carolina Dr Unit 23
- 11698 S Carolina Dr Unit 28
- 27313 Rue Viauv Ave
- 27300 Duvernay Dr
- 11709 S Carolina Dr Unit 138
- 26422 Atlanta Dr Unit 128
- 12249 Londonderry Ln
- 26728 Little John Ct Unit 6
- 26871 Nicki J Ct
- 26850 Nicki J Ct
- 26891 Nicki J Ct
- 26890 Nicki J Ct
- 26911 Nicki J Ct
- 26910 Nicki J Ct
- 26931 Nicki J Ct
- 11851 E Terry St
- 26930 Nicki J Ct
- 26951 Nicki J Ct
- 26950 Nicki J Ct
- 26900 Red Blossom Ct
- 26910 Red Blossom Ct
- 11820 Red Hibiscus Dr
- 26890 Red Blossom Ct
- 11931 Palm Bay Ct Unit 102
- 11931 Palm Bay Ct Unit 202
- 11931 Palm Bay Ct Unit 101
- 11931 Palm Bay Ct Unit 201
- 26971 Nicki J Ct