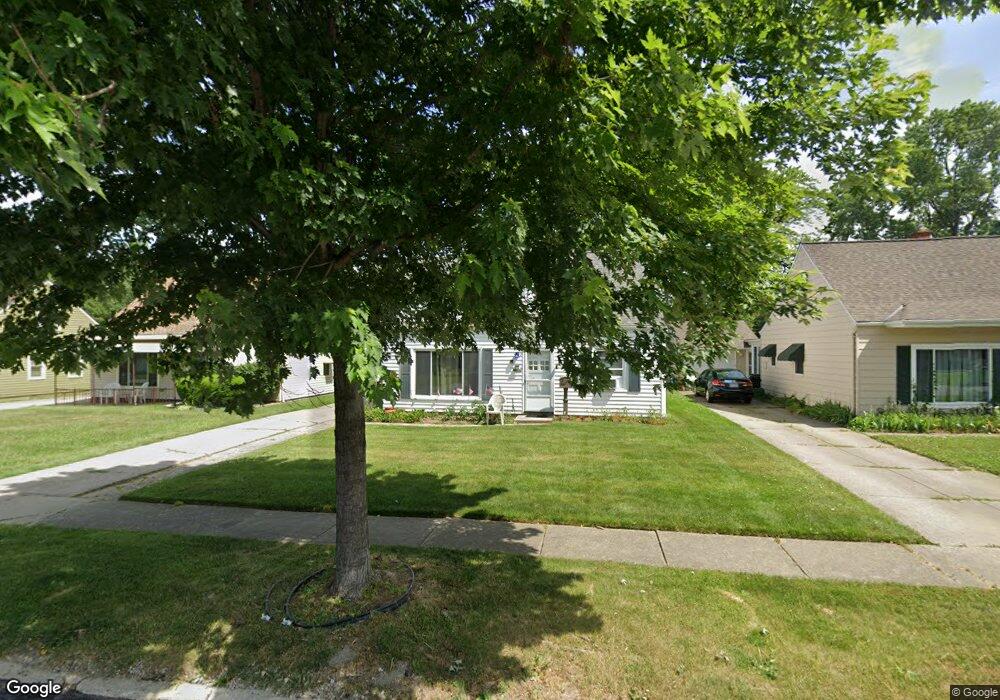
26851 Shirley Ave Euclid, OH 44132
Estimated Value: $140,346 - $145,000
4
Beds
2
Baths
1,241
Sq Ft
$115/Sq Ft
Est. Value
About This Home
This home is located at 26851 Shirley Ave, Euclid, OH 44132 and is currently estimated at $142,337, approximately $114 per square foot. 26851 Shirley Ave is a home located in Cuyahoga County with nearby schools including Shoreview Elementary School, Euclid High School, and Ss. Robert & William Catholic School.
Ownership History
Date
Name
Owned For
Owner Type
Purchase Details
Closed on
Jun 1, 2002
Sold by
Dujmovic Bracak Ivica and Dujmovic Bracak Ankica
Bought by
Vandermark Guy E and Vandermark Tami L
Current Estimated Value
Home Financials for this Owner
Home Financials are based on the most recent Mortgage that was taken out on this home.
Original Mortgage
$87,526
Interest Rate
7%
Mortgage Type
FHA
Purchase Details
Closed on
Sep 29, 1995
Sold by
Cox James J
Bought by
Bracak Ivica and Bracak Ankica Dujmovic
Home Financials for this Owner
Home Financials are based on the most recent Mortgage that was taken out on this home.
Original Mortgage
$60,000
Interest Rate
8%
Mortgage Type
New Conventional
Purchase Details
Closed on
Jun 28, 1985
Sold by
Vendeland Dale L
Bought by
James J Cox
Purchase Details
Closed on
Jan 1, 1975
Bought by
Vendeland Dale L
Create a Home Valuation Report for This Property
The Home Valuation Report is an in-depth analysis detailing your home's value as well as a comparison with similar homes in the area
Home Values in the Area
Average Home Value in this Area
Purchase History
| Date | Buyer | Sale Price | Title Company |
|---|---|---|---|
| Vandermark Guy E | -- | Insignia Title Agency Ltd | |
| Bracak Ivica | $67,000 | -- | |
| James J Cox | $50,000 | -- | |
| Vendeland Dale L | -- | -- |
Source: Public Records
Mortgage History
| Date | Status | Borrower | Loan Amount |
|---|---|---|---|
| Previous Owner | Vandermark Guy E | $87,526 | |
| Previous Owner | Bracak Ivica | $60,000 |
Source: Public Records
Tax History Compared to Growth
Tax History
| Year | Tax Paid | Tax Assessment Tax Assessment Total Assessment is a certain percentage of the fair market value that is determined by local assessors to be the total taxable value of land and additions on the property. | Land | Improvement |
|---|---|---|---|---|
| 2024 | $3,106 | $45,115 | $8,435 | $36,680 |
| 2023 | $2,539 | $29,160 | $6,370 | $22,790 |
| 2022 | $2,482 | $29,155 | $6,370 | $22,785 |
| 2021 | $2,763 | $29,160 | $6,370 | $22,790 |
| 2020 | $2,621 | $25,130 | $5,500 | $19,640 |
| 2019 | $2,356 | $71,800 | $15,700 | $56,100 |
| 2018 | $2,361 | $25,130 | $5,500 | $19,640 |
| 2017 | $2,541 | $22,470 | $4,550 | $17,920 |
| 2016 | $2,547 | $22,470 | $4,550 | $17,920 |
| 2015 | $2,319 | $22,470 | $4,550 | $17,920 |
| 2014 | $2,319 | $22,470 | $4,550 | $17,920 |
Source: Public Records
Map
Nearby Homes
- 712 E 266th St
- 26471 Farringdon Ave
- 27101 Zeman Ave
- 27190 Shoreview Ave
- 26351 Farringdon Ave
- 26430 Drakefield Ave
- 780 E 266th St
- 26471 Shoreview Ave
- 635 E 261st St
- 640 E 261st St
- 26171 Shoreview Ave
- 26230 Oriole Ave
- 559 Sycamore Dr
- 577 Sycamore Dr
- 461 E 271st St
- 25750 Drakefield Ave
- 25671 Farringdon Ave
- 405 E 262nd St
- 440 E 271st St
- 25700 Briardale Ave
- 26831 Shirley Ave
- 26871 Shirley Ave
- 26801 Shirley Ave
- 26891 Shirley Ave
- 26850 Farringdon Ave
- 26830 Farringdon Ave
- 26870 Farringdon Ave
- 26901 Shirley Ave
- 26800 Farringdon Ave
- 26890 Farringdon Ave
- 26850 Shirley Ave
- 685 E 266th St
- 26830 Shirley Ave
- 26870 Shirley Ave
- 681 E 266th St
- 695 E 266th St
- 26900 Farringdon Ave
- 26890 Shirley Ave
- 675 E 266th St
- 701 E 266th St