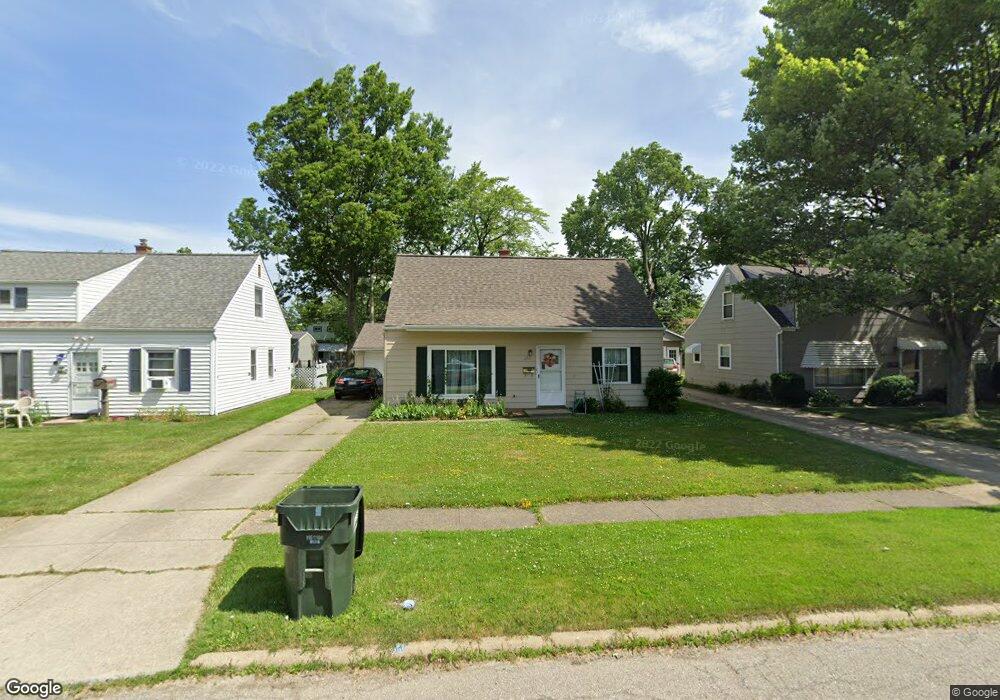
26871 Shirley Ave Euclid, OH 44132
Estimated Value: $124,093 - $150,000
2
Beds
1
Bath
1,241
Sq Ft
$112/Sq Ft
Est. Value
About This Home
This home is located at 26871 Shirley Ave, Euclid, OH 44132 and is currently estimated at $138,523, approximately $111 per square foot. 26871 Shirley Ave is a home located in Cuyahoga County with nearby schools including Shoreview Elementary School, Euclid High School, and Ss. Robert & William Catholic School.
Ownership History
Date
Name
Owned For
Owner Type
Purchase Details
Closed on
Mar 14, 2002
Sold by
Tizzano Stacy A
Bought by
Stefanchik Mary E
Current Estimated Value
Home Financials for this Owner
Home Financials are based on the most recent Mortgage that was taken out on this home.
Original Mortgage
$61,000
Outstanding Balance
$25,284
Interest Rate
6.95%
Estimated Equity
$113,239
Purchase Details
Closed on
Jul 29, 1999
Sold by
Piscitello Angela S and Wojtylak Angela S
Bought by
Tizzano Stacy A
Home Financials for this Owner
Home Financials are based on the most recent Mortgage that was taken out on this home.
Original Mortgage
$69,300
Interest Rate
7.25%
Purchase Details
Closed on
May 29, 1992
Sold by
Gallagher Elizabeth C
Bought by
Piscitello Angela S
Purchase Details
Closed on
Jan 1, 1975
Bought by
Gallagher Elizabeth C
Create a Home Valuation Report for This Property
The Home Valuation Report is an in-depth analysis detailing your home's value as well as a comparison with similar homes in the area
Home Values in the Area
Average Home Value in this Area
Purchase History
| Date | Buyer | Sale Price | Title Company |
|---|---|---|---|
| Stefanchik Mary E | $82,000 | Executive Title Agency Corp | |
| Tizzano Stacy A | $77,000 | Approved Statewide Title Age | |
| Piscitello Angela S | $57,000 | -- | |
| Gallagher Elizabeth C | -- | -- |
Source: Public Records
Mortgage History
| Date | Status | Borrower | Loan Amount |
|---|---|---|---|
| Open | Stefanchik Mary E | $61,000 | |
| Previous Owner | Tizzano Stacy A | $69,300 |
Source: Public Records
Tax History Compared to Growth
Tax History
| Year | Tax Paid | Tax Assessment Tax Assessment Total Assessment is a certain percentage of the fair market value that is determined by local assessors to be the total taxable value of land and additions on the property. | Land | Improvement |
|---|---|---|---|---|
| 2024 | $2,821 | $40,775 | $8,435 | $32,340 |
| 2023 | $2,363 | $27,020 | $6,370 | $20,650 |
| 2022 | $2,310 | $27,020 | $6,370 | $20,650 |
| 2021 | $2,570 | $27,020 | $6,370 | $20,650 |
| 2020 | $2,441 | $23,310 | $5,500 | $17,820 |
| 2019 | $2,193 | $66,600 | $15,700 | $50,900 |
| 2018 | $2,214 | $23,310 | $5,500 | $17,820 |
| 2017 | $2,329 | $20,510 | $4,550 | $15,960 |
| 2016 | $2,334 | $20,510 | $4,550 | $15,960 |
| 2015 | $2,127 | $20,510 | $4,550 | $15,960 |
| 2014 | $2,127 | $20,510 | $4,550 | $15,960 |
Source: Public Records
Map
Nearby Homes
- 27101 Zeman Ave
- 712 E 266th St
- 26471 Farringdon Ave
- 27190 Shoreview Ave
- 26351 Farringdon Ave
- 26430 Drakefield Ave
- 780 E 266th St
- 26471 Shoreview Ave
- 635 E 261st St
- 640 E 261st St
- 26171 Shoreview Ave
- 559 Sycamore Dr
- 577 Sycamore Dr
- 26230 Oriole Ave
- 461 E 271st St
- 440 E 271st St
- 25750 Drakefield Ave
- 405 E 262nd St
- 25671 Farringdon Ave
- 415 E 266th St
- 26891 Shirley Ave
- 26851 Shirley Ave
- 26901 Shirley Ave
- 26831 Shirley Ave
- 26870 Farringdon Ave
- 26890 Farringdon Ave
- 26850 Farringdon Ave
- 26801 Shirley Ave
- 26830 Farringdon Ave
- 26900 Farringdon Ave
- 26870 Shirley Ave
- 26850 Shirley Ave
- 26890 Shirley Ave
- 26800 Farringdon Ave
- 26930 Farringdon Ave
- 26830 Shirley Ave
- 26900 Shirley Ave
- 26951 Shirley Ave
- 685 E 266th St
- 26930 Shirley Ave