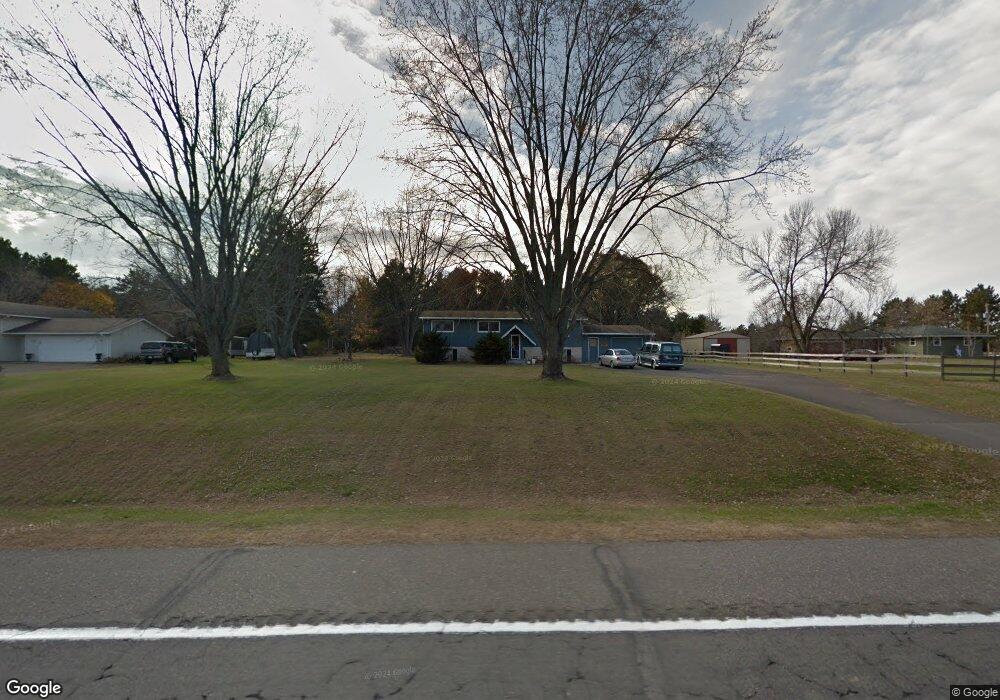
26880 146th St NW Zimmerman, MN 55398
Estimated Value: $352,559 - $389,000
5
Beds
2
Baths
1,104
Sq Ft
$333/Sq Ft
Est. Value
About This Home
This home is located at 26880 146th St NW, Zimmerman, MN 55398 and is currently estimated at $367,390, approximately $332 per square foot. 26880 146th St NW is a home located in Sherburne County with nearby schools including Westwood Elementary School, Zimmerman Elementary School, and Zimmerman Middle School.
Ownership History
Date
Name
Owned For
Owner Type
Purchase Details
Closed on
Dec 26, 2018
Sold by
Guy Shawn Anthany and Guy Lisa
Bought by
Guy Shawn Anthany and Guy Lisa
Current Estimated Value
Purchase Details
Closed on
Mar 17, 2014
Sold by
Secretary Of Housing & Urban Development
Bought by
Guy Shawn Anthany
Home Financials for this Owner
Home Financials are based on the most recent Mortgage that was taken out on this home.
Original Mortgage
$96,938
Outstanding Balance
$73,503
Interest Rate
4.35%
Mortgage Type
New Conventional
Estimated Equity
$293,887
Purchase Details
Closed on
Sep 10, 2013
Sold by
Franklin American Mortgage Company
Bought by
The Secretary Of Housing & Urban Develop
Purchase Details
Closed on
May 20, 2013
Sold by
Robinson Gary Neill and Robinson Carey
Bought by
Franklin American Mortgage Company
Create a Home Valuation Report for This Property
The Home Valuation Report is an in-depth analysis detailing your home's value as well as a comparison with similar homes in the area
Home Values in the Area
Average Home Value in this Area
Purchase History
| Date | Buyer | Sale Price | Title Company |
|---|---|---|---|
| Guy Shawn Anthany | -- | Abstracts & Titles | |
| Guy Shawn Anthany | -- | Executive Title | |
| The Secretary Of Housing & Urban Develop | -- | None Available | |
| Franklin American Mortgage Company | $217,071 | None Available |
Source: Public Records
Mortgage History
| Date | Status | Borrower | Loan Amount |
|---|---|---|---|
| Open | Guy Shawn Anthany | $96,938 |
Source: Public Records
Tax History Compared to Growth
Tax History
| Year | Tax Paid | Tax Assessment Tax Assessment Total Assessment is a certain percentage of the fair market value that is determined by local assessors to be the total taxable value of land and additions on the property. | Land | Improvement |
|---|---|---|---|---|
| 2025 | $3,678 | $320,800 | $140,300 | $180,500 |
| 2024 | $3,686 | $258,500 | $123,100 | $135,400 |
| 2023 | $3,662 | $257,800 | $123,100 | $134,700 |
| 2022 | $3,326 | $240,900 | $104,100 | $136,800 |
| 2020 | $1,944 | $167,400 | $57,800 | $109,600 |
| 2019 | $1,670 | $160,300 | $55,500 | $104,800 |
| 2018 | $1,598 | $151,300 | $52,900 | $98,400 |
| 2017 | $1,420 | $140,200 | $48,900 | $91,300 |
| 2016 | $1,378 | $125,300 | $38,500 | $86,800 |
| 2015 | $1,544 | $96,900 | $30,300 | $66,600 |
| 2014 | $1,548 | $114,100 | $31,700 | $82,400 |
| 2013 | -- | $106,900 | $27,700 | $79,200 |
Source: Public Records
Map
Nearby Homes
- 26815 147th St NW
- 14271 271st Ave NW
- 26659 145th St NW
- 26743 Woodlands Pkwy
- 13905 272nd Ave NW
- 26177 150th St NW
- 13911 7th Ave N
- 25916 24th St W
- 26437 Ridgewood Rd
- 13940 3rd Ave S
- 26483 W Timberhill Rd
- 25884 23rd St W
- 13788 4th Ave S
- 26407 E Timberhill Rd
- 13209 Oakwood Rd
- 25810 19th St W
- 13151 13th Ave N
- 14941 283rd Ln NW
- 13098 13th N
- 26072 159th St NW
- 26856 146th St NW
- 26910 146th St NW
- 26834 146th St NW
- 26871 146th St NW
- 26928 146th St NW
- 14622 268th Ave NW
- 26929 146th St NW
- 26881 147th St NW
- 26849 147th St NW
- 26978 146th St NW
- 27017 145th St NW
- 14621 268th Ave NW
- 0 146th St NW
- 26886 147th St NW
- 14663 268th Ave NW
- 26852 147th St NW
- 26762 146th St NW
- XXXX1 145th St NW
- xxx1 145th St NW
- 27006 146th St NW