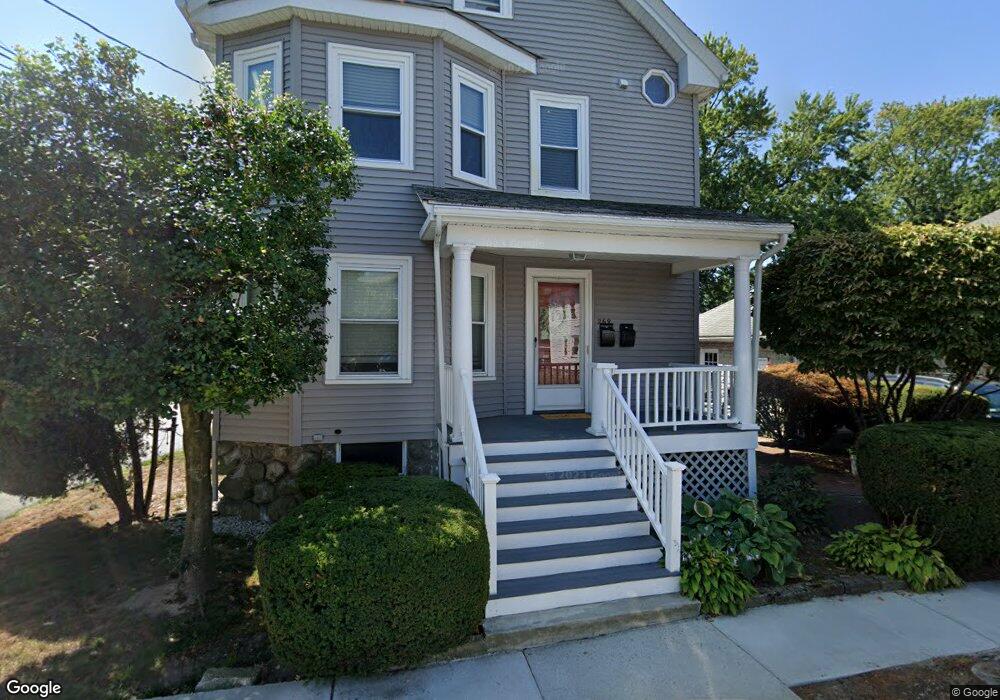
269 Brown St Waltham, MA 02453
South Side NeighborhoodEstimated Value: $856,453 - $951,000
4
Beds
3
Baths
1,589
Sq Ft
$574/Sq Ft
Est. Value
About This Home
This home is located at 269 Brown St, Waltham, MA 02453 and is currently estimated at $911,863, approximately $573 per square foot. 269 Brown St is a home located in Middlesex County with nearby schools including Henry Whittemore Elementary School, John W. Mcdevitt Middle School, and Waltham Sr High School.
Ownership History
Date
Name
Owned For
Owner Type
Purchase Details
Closed on
May 13, 2013
Sold by
Leone Jenette M and Leone Michael
Bought by
Leone Jenette M and Leone Michael
Current Estimated Value
Purchase Details
Closed on
Aug 29, 1997
Sold by
Brosnahan Eillen C and Blasewicz Patricia A
Bought by
Capello Jeannette M and Leone Michael
Home Financials for this Owner
Home Financials are based on the most recent Mortgage that was taken out on this home.
Original Mortgage
$165,000
Interest Rate
7.41%
Mortgage Type
Purchase Money Mortgage
Purchase Details
Closed on
May 19, 1988
Sold by
Good Michael E
Bought by
Brosnahan Eileen C
Home Financials for this Owner
Home Financials are based on the most recent Mortgage that was taken out on this home.
Original Mortgage
$212,550
Interest Rate
10.13%
Mortgage Type
Purchase Money Mortgage
Create a Home Valuation Report for This Property
The Home Valuation Report is an in-depth analysis detailing your home's value as well as a comparison with similar homes in the area
Home Values in the Area
Average Home Value in this Area
Purchase History
| Date | Buyer | Sale Price | Title Company |
|---|---|---|---|
| Leone Jenette M | -- | -- | |
| Leone Jenette M | -- | -- | |
| Capello Jeannette M | $225,000 | -- | |
| Brosnahan Eileen C | $235,000 | -- |
Source: Public Records
Mortgage History
| Date | Status | Borrower | Loan Amount |
|---|---|---|---|
| Previous Owner | Brosnahan Eileen C | $165,000 | |
| Previous Owner | Brosnahan Eileen C | $212,550 |
Source: Public Records
Tax History Compared to Growth
Tax History
| Year | Tax Paid | Tax Assessment Tax Assessment Total Assessment is a certain percentage of the fair market value that is determined by local assessors to be the total taxable value of land and additions on the property. | Land | Improvement |
|---|---|---|---|---|
| 2025 | $6,861 | $698,700 | $339,400 | $359,300 |
| 2024 | $6,397 | $663,600 | $339,400 | $324,200 |
| 2023 | $6,400 | $620,200 | $309,100 | $311,100 |
| 2022 | $6,472 | $581,000 | $282,200 | $298,800 |
| 2021 | $6,039 | $533,500 | $255,400 | $278,100 |
| 2020 | $6,001 | $502,200 | $241,900 | $260,300 |
| 2019 | $5,748 | $454,000 | $239,500 | $214,500 |
| 2018 | $5,222 | $414,100 | $221,800 | $192,300 |
| 2017 | $4,947 | $393,900 | $201,600 | $192,300 |
| 2016 | $4,534 | $370,400 | $178,100 | $192,300 |
| 2015 | $4,412 | $336,000 | $174,700 | $161,300 |
Source: Public Records
Map
Nearby Homes
- 162 Myrtle St Unit 1
- 138 Myrtle St Unit 2
- 24 Tolman St Unit A
- 25 Tolman St Unit 2
- 312 Newton St Unit 1A
- 308 Newton St Unit 1
- 75 Cherry St
- 81 Alder St
- 39 Clinton St Unit 2
- 39 Clinton St Unit 1
- 47 Alder St Unit 6
- 40 Myrtle St Unit 9
- 42 Alder St
- 9 John St
- 76 Taft Ave Unit 1
- 76 Taft Ave
- 76 Taft Ave Unit 2
- 31-37 Washington Ave
- 15 Alder St Unit 1
- 659 Moody St Unit 2
- 81 Parmenter Rd
- 83 Parmenter Rd
- 83 Parmenter Rd Unit 1
- 83 Parmenter Rd
- 83 Parmenter Rd Unit 2
- 266 Brown St Unit 268
- 266 Brown St Unit 1
- 266 Brown St
- 259 Brown St Unit 261
- 71 Parmenter Rd
- 76 Parmenter Rd Unit 78
- 260 Brown St Unit 262
- 260 Brown St
- 260 Brown St
- 262 Brown St
- 260 Brown St Unit 260
- 262 Brown St Unit 2
- 72 Parmenter Rd Unit 74
- 72 Parmenter Rd Unit 74
- 72-74 Parmenter Rd Unit 72