
Seller's Agent in 2025
Shawn Oliver
eXp Realty, LLC
(912) 424-9110
391 Total Sales


Located in the desirable Odum School District, this spacious 4-bedroom, 2-bathroom home sits on a generous 1.61-acre lot and offers a perfect blend of comfort and outdoor living. Built in 2006, the home features a well-thought-out layout with a mix of LVP, carpet, and tile flooring throughout.
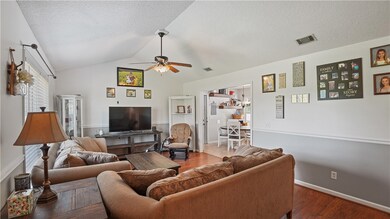
The 4th bedroom is a garage conversion and includes its own mini-split unit for customized climate control—ideal for guests, a home office, or additional living space. The eat-in kitchen boasts white cabinetry with granite countertops, while the vaulted ceiling in the living room adds an airy, open feel.
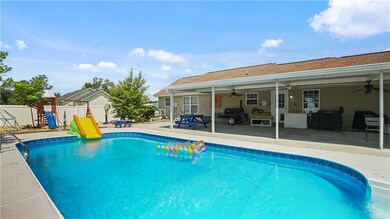
Step outside to enjoy a large covered patio overlooking a fully fenced in-ground pool, perfect for entertaining or relaxing in privacy. The property also includes a storage shed, covered shelter, and an expansive garden area equipped with sprinklers—a dream setup for gardening enthusiasts.
The primary suite features double closets and an en-suite bath with dual sinks, offering both space and functionality.
Don't miss this rare opportunity for peaceful country living with all the modern comforts!
| Date | Type | Sale Price | Title Company |
|---|---|---|---|
| Warranty Deed | $290,000 | -- | |
| Warranty Deed | -- | -- | |
| Warranty Deed | $150,000 | -- | |
| Warranty Deed | $110,000 | -- | |
| Deed | -- | -- |
| Date | Status | Loan Amount | Loan Type |
|---|---|---|---|
| Open | $296,235 | VA | |
| Previous Owner | $147,283 | FHA | |
| Previous Owner | $112,244 | New Conventional |
| Date | Event | Price | List to Sale | Price per Sq Ft |
|---|---|---|---|---|
| 10/03/2025 10/03/25 | Sold | $290,000 | 0.0% | $181 / Sq Ft |
| 09/06/2025 09/06/25 | Pending | -- | -- | -- |
| 07/31/2025 07/31/25 | For Sale | $290,000 | -- | $181 / Sq Ft |
| Year | Tax Paid | Tax Assessment Tax Assessment Total Assessment is a certain percentage of the fair market value that is determined by local assessors to be the total taxable value of land and additions on the property. | Land | Improvement |
|---|---|---|---|---|
| 2024 | $1,679 | $68,374 | $2,576 | $65,798 |
| 2023 | $1,835 | $61,168 | $2,576 | $58,592 |
| 2022 | $1,451 | $51,079 | $2,576 | $48,503 |
| 2021 | $1,377 | $45,832 | $2,576 | $43,256 |
| 2020 | $1,424 | $45,832 | $2,576 | $43,256 |
| 2019 | $1,646 | $45,832 | $2,576 | $43,256 |
| 2018 | $1,467 | $45,832 | $2,576 | $43,256 |
| 2017 | $335 | $36,102 | $2,576 | $33,526 |
| 2016 | $1,080 | $36,102 | $2,576 | $33,526 |
| 2014 | $933 | $36,102 | $2,576 | $33,526 |
| 2013 | -- | $36,101 | $2,576 | $33,525 |
Seller's Agent in 2025
Shawn Oliver
eXp Realty, LLC
(912) 424-9110
391 Total Sales
K
Buyer's Agent in 2025
Karoline Davis
Coldwell Banker Southern Coast
(912) 368-4300
28 Total Sales
Source: Golden Isles Association of REALTORS®
MLS Number: 1655527
APN: 82-63
Disclaimer: Certain information contained herein is derived from information provided by parties other than Homes.com. All information provided is deemed reliable, but is not guaranteed to be accurate and should be independently verified.
![]() IDX information is provided exclusively for personal, non-commercial use, and may not be used for any purpose other than to identify prospective properties consumers may be interested in purchasing. Information is deemed reliable but not guaranteed.
IDX information is provided exclusively for personal, non-commercial use, and may not be used for any purpose other than to identify prospective properties consumers may be interested in purchasing. Information is deemed reliable but not guaranteed.