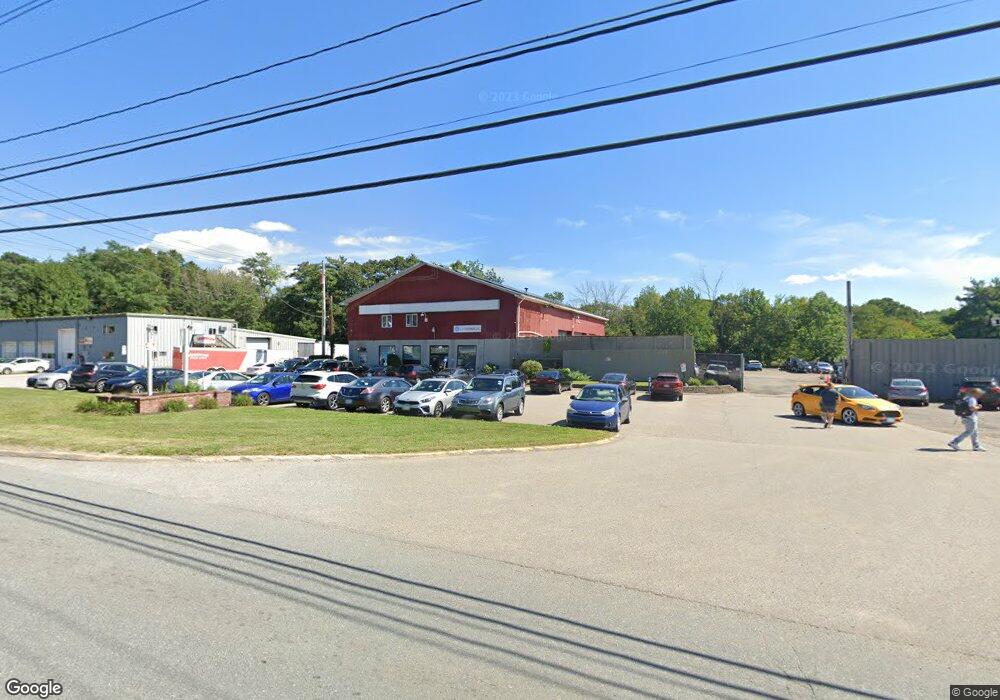
269 Dedham St Norfolk, MA 02056
Estimated Value: $2,435,343
--
Bed
1
Bath
8,712
Sq Ft
$280/Sq Ft
Est. Value
About This Home
This home is located at 269 Dedham St, Norfolk, MA 02056 and is currently priced at $2,435,343, approximately $279 per square foot. 269 Dedham St is a home located in Norfolk County with nearby schools including H. Olive Day School, Freeman-Kennedy School, and Foxborough Regional Charter School.
Ownership History
Date
Name
Owned For
Owner Type
Purchase Details
Closed on
Aug 11, 2016
Sold by
Cdg Rt
Bought by
269 Dedham Street Llc
Current Estimated Value
Home Financials for this Owner
Home Financials are based on the most recent Mortgage that was taken out on this home.
Original Mortgage
$600,000
Outstanding Balance
$478,730
Interest Rate
3.48%
Mortgage Type
Commercial
Purchase Details
Closed on
Nov 5, 2009
Sold by
Mitchell Linda A and Mitchell Linda E
Bought by
Cdg Rt and Gardner
Home Financials for this Owner
Home Financials are based on the most recent Mortgage that was taken out on this home.
Original Mortgage
$588,000
Interest Rate
5.06%
Mortgage Type
Commercial
Purchase Details
Closed on
Jun 2, 2008
Sold by
Mitchell Richard H
Bought by
Mitchell Linda A and Mitchell Linda E
Create a Home Valuation Report for This Property
The Home Valuation Report is an in-depth analysis detailing your home's value as well as a comparison with similar homes in the area
Home Values in the Area
Average Home Value in this Area
Purchase History
| Date | Buyer | Sale Price | Title Company |
|---|---|---|---|
| 269 Dedham Street Llc | $1,400,000 | -- | |
| Cdg Rt | $735,000 | -- | |
| Cdg Rt | $735,000 | -- | |
| Mitchell Linda A | -- | -- | |
| Mitchell Linda A | -- | -- |
Source: Public Records
Mortgage History
| Date | Status | Borrower | Loan Amount |
|---|---|---|---|
| Open | 269 Dedham Street Llc | $600,000 | |
| Closed | Mitchell Linda A | $600,000 | |
| Previous Owner | Mitchell Linda A | $125,000 | |
| Previous Owner | Cdg Rt | $588,000 |
Source: Public Records
Tax History Compared to Growth
Tax History
| Year | Tax Paid | Tax Assessment Tax Assessment Total Assessment is a certain percentage of the fair market value that is determined by local assessors to be the total taxable value of land and additions on the property. | Land | Improvement |
|---|---|---|---|---|
| 2025 | $12,001 | $751,500 | $212,500 | $539,000 |
| 2024 | $11,701 | $751,500 | $212,500 | $539,000 |
| 2023 | $10,860 | $661,800 | $185,500 | $476,300 |
| 2022 | $11,462 | $629,800 | $185,500 | $444,300 |
| 2021 | $11,330 | $629,800 | $185,500 | $444,300 |
| 2020 | $9,341 | $501,100 | $180,000 | $321,100 |
| 2019 | $8,781 | $480,100 | $180,000 | $300,100 |
| 2018 | $8,939 | $480,100 | $180,000 | $300,100 |
| 2017 | $8,747 | $480,100 | $180,000 | $300,100 |
| 2016 | $8,572 | $474,100 | $180,000 | $294,100 |
| 2015 | $6,923 | $392,000 | $173,700 | $218,300 |
| 2014 | $6,833 | $392,000 | $173,700 | $218,300 |
Source: Public Records
Map
Nearby Homes
- 71 Pond St
- 7 Hill St Unit 10
- 7 Hill St Unit 11
- 46 Weber Farm Rd Unit 46
- 25 Foxboro Rd
- 10 W Birch Rd
- 48 Mirror Lake Ave
- 6 Forest Grove Ave
- 270 Dedham St
- 1 Lorraine Metcalf Dr
- 2 Diamond St
- 246 Forest Grove Ave
- 8 Conway Ln
- 11 Goodwin Dr
- 38 Robin Rd
- 45 King St
- 3 Pheasanthill Rd
- 5 Post Rd
- 14 Robin Rd
- 10 Tilting Rock Rd
- 271 Dedham St
- 0 Sharon Ave
- 250 Dedham St
- 273 Dedham St
- 242 Dedham St
- 4 Sharon Ave Unit C
- 4 Sharon Ave Unit A
- 4 Sharon Ave Unit B
- 4 Sharon Ave
- 262 Dedham St
- Lot 5 Sharon Dr
- 227 Dedham St
- 6 Sharon Ave
- 5 Cushing Dr
- 224 Dedham St
- 224 Dedham St Unit 1
- 8 Sharon Ave
- 228 Dedham St
- 9 Sharon Ave
- 282 Dedham St