269 Hanson Way Marietta, GA 30064
Northwestern Marietta NeighborhoodEstimated Value: $1,688,000 - $1,954,000
5
Beds
8
Baths
7,517
Sq Ft
$241/Sq Ft
Est. Value
About This Home
This home is located at 269 Hanson Way, Marietta, GA 30064 and is currently estimated at $1,814,295, approximately $241 per square foot. 269 Hanson Way is a home located in Cobb County with nearby schools including West Side Elementary School, Marietta Sixth Grade Academy, and Marietta Middle School.
Ownership History
Date
Name
Owned For
Owner Type
Purchase Details
Closed on
Feb 21, 2024
Sold by
Garriss George W and Garriss Renee I
Bought by
Jin Hangyi and Yi Yusen
Current Estimated Value
Purchase Details
Closed on
Nov 30, 2010
Sold by
Cwalt Inc Al Trust 2006-Oa10
Bought by
Garriss Renee I and Garris George
Home Financials for this Owner
Home Financials are based on the most recent Mortgage that was taken out on this home.
Original Mortgage
$511,200
Interest Rate
4.32%
Mortgage Type
New Conventional
Purchase Details
Closed on
Nov 3, 2009
Sold by
Cheatham W Lamar
Bought by
Bank Of Ny Mellon
Purchase Details
Closed on
May 4, 2005
Sold by
Keeler Woods Joint Ventures Llc
Bought by
Cheatham W Lamar
Home Financials for this Owner
Home Financials are based on the most recent Mortgage that was taken out on this home.
Original Mortgage
$1,056,000
Interest Rate
5.99%
Create a Home Valuation Report for This Property
The Home Valuation Report is an in-depth analysis detailing your home's value as well as a comparison with similar homes in the area
Home Values in the Area
Average Home Value in this Area
Purchase History
| Date | Buyer | Sale Price | Title Company |
|---|---|---|---|
| Jin Hangyi | $1,680,000 | None Listed On Document | |
| Garriss Renee I | $639,000 | -- | |
| Bank Of Ny Mellon | $815,000 | -- | |
| Cheatham W Lamar | $250,000 | -- |
Source: Public Records
Mortgage History
| Date | Status | Borrower | Loan Amount |
|---|---|---|---|
| Previous Owner | Garriss Renee I | $511,200 | |
| Previous Owner | Cheatham W Lamar | $1,056,000 |
Source: Public Records
Tax History Compared to Growth
Tax History
| Year | Tax Paid | Tax Assessment Tax Assessment Total Assessment is a certain percentage of the fair market value that is determined by local assessors to be the total taxable value of land and additions on the property. | Land | Improvement |
|---|---|---|---|---|
| 2025 | $5,437 | $642,624 | $180,000 | $462,624 |
| 2024 | $5,437 | $642,624 | $180,000 | $462,624 |
| 2023 | $1,926 | $642,624 | $180,000 | $462,624 |
| 2022 | $2,078 | $494,344 | $100,000 | $394,344 |
| 2021 | $2,142 | $494,088 | $100,000 | $394,088 |
| 2020 | $2,136 | $450,276 | $100,000 | $350,276 |
| 2019 | $2,306 | $450,276 | $100,000 | $350,276 |
| 2018 | $2,306 | $450,276 | $100,000 | $350,276 |
| 2017 | $1,854 | $450,276 | $100,000 | $350,276 |
| 2016 | $1,870 | $439,452 | $100,000 | $339,452 |
| 2015 | $2,058 | $439,452 | $100,000 | $339,452 |
| 2014 | $2,064 | $279,784 | $0 | $0 |
Source: Public Records
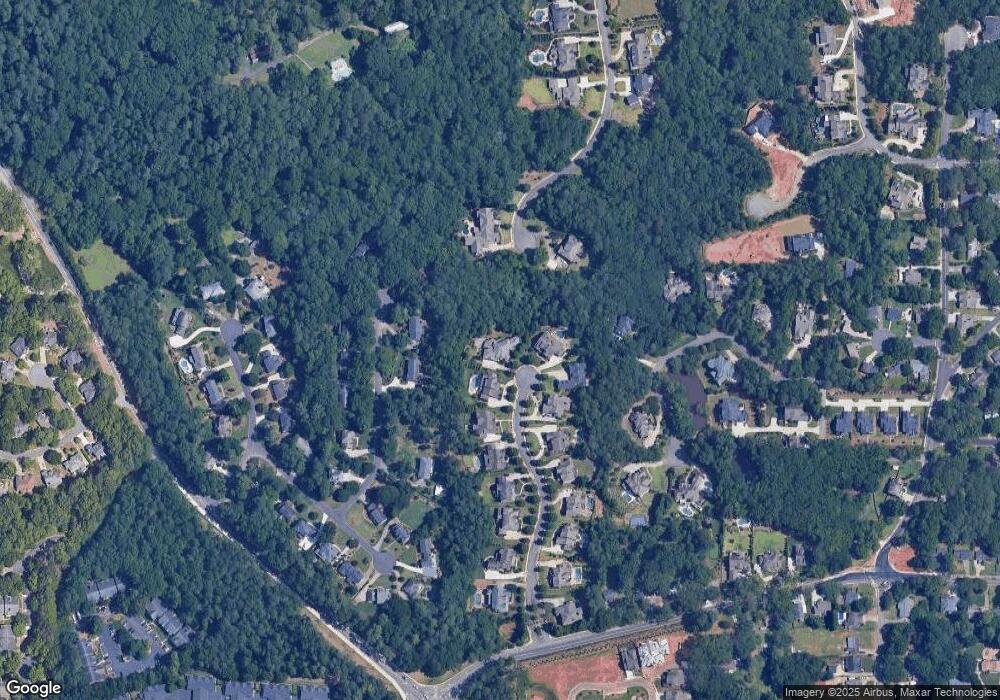
Map
Nearby Homes
- 306 Anders Pth NW
- 314 Anders Path
- 201 Wakehurst Way
- 002 Wakehurst Way
- 735 Stewart Ave NW
- 917 Wemberley Ln
- 909 Wemberley Ln
- 984 Wemberley Ln
- 746 Polk St NW
- 705 Stewart Cir NW
- 920 Wemberley Ln
- 740 Polk St NW
- 927 Burnt Hickory Cir NW Unit 10
- 1099 Burnt Hickory Rd NW
- 945 Burnt Hickory Cir NW Unit 8
- 608 Keeler Woods Dr NW
- 1077 New Haven Dr SW Unit 12A
- 527 N Saint Marys Ln NW
- 282 Evelyn St NW
- 1141 Whitlock Ave NW
- 269 Hanson Way NW
- 263 Hanson Way
- 257 Hanson Way
- 307 Anders Pth NW
- 222 Mountain Brook Dr NW
- 212 Mountain Brook Dr NW
- 212 Mountain Brook Dr NW
- 242 Mountain Brook Dr NW
- 262 Hanson Way
- 256 Hanson Way
- 251 Hanson Way
- 192 Mountain Brook Dr NW
- 250 Hanson Way
- 311 Anders Path
- 182 Mountain Brook Dr NW
- 245 Hanson Way
- 217 Mountain Brook Dr NW
- 842 Oakton Pond Ct NW
- 217 Mountain Brook Dr NW
- 244 Hanson Way NW