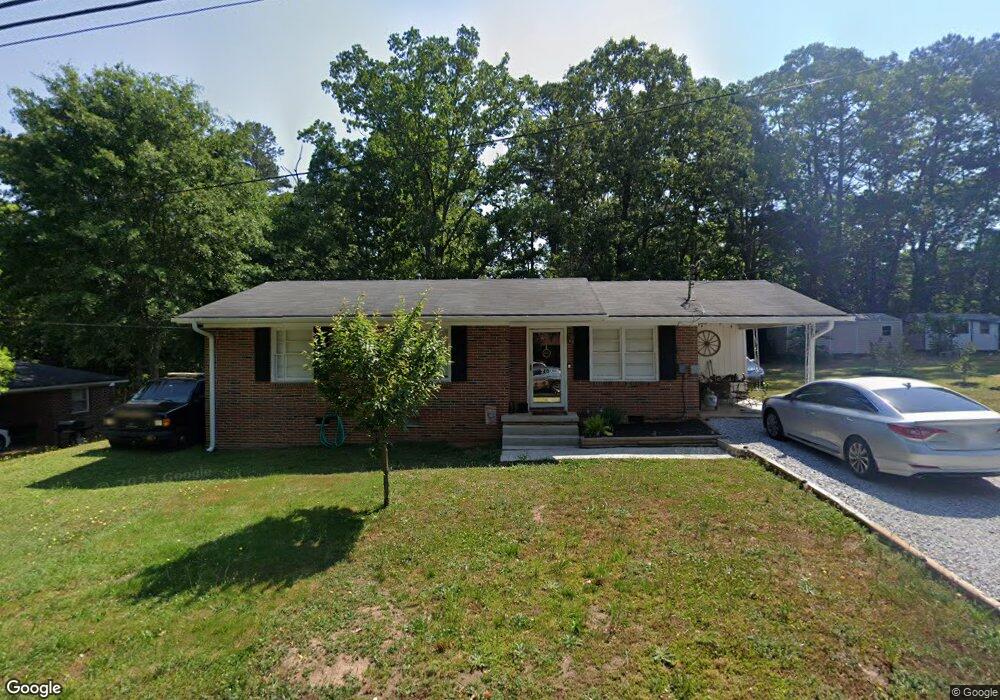
269 Hilltop Ln Toccoa, GA 30577
Estimated Value: $127,000 - $156,000
3
Beds
1
Bath
1,018
Sq Ft
$138/Sq Ft
Est. Value
About This Home
This home is located at 269 Hilltop Ln, Toccoa, GA 30577 and is currently estimated at $140,989, approximately $138 per square foot. 269 Hilltop Ln is a home located in Stephens County with nearby schools including Stephens County High School.
Ownership History
Date
Name
Owned For
Owner Type
Purchase Details
Closed on
Feb 4, 2021
Sold by
Patel Paresh
Bought by
Akshiv Property Management Corp
Current Estimated Value
Purchase Details
Closed on
Apr 14, 2017
Sold by
Payne Barbara T
Bought by
Patel Paresh
Purchase Details
Closed on
Dec 11, 2009
Sold by
Phillips Gregory A
Bought by
Payne Barbara T
Purchase Details
Closed on
Jul 25, 2007
Sold by
Waterwheel Properties Llc
Bought by
Phillips Gregory A
Home Financials for this Owner
Home Financials are based on the most recent Mortgage that was taken out on this home.
Original Mortgage
$96,485
Interest Rate
6.63%
Mortgage Type
FHA
Purchase Details
Closed on
Jun 16, 2006
Sold by
Rice Levi N
Bought by
Waterwheel Properties Llc
Purchase Details
Closed on
Nov 1, 2005
Sold by
Labossiere John
Bought by
Bank Of New York Trustee
Purchase Details
Closed on
May 25, 2005
Sold by
Mize Lydia B
Bought by
Labossiere John
Create a Home Valuation Report for This Property
The Home Valuation Report is an in-depth analysis detailing your home's value as well as a comparison with similar homes in the area
Purchase History
| Date | Buyer | Sale Price | Title Company |
|---|---|---|---|
| Akshiv Property Management Corp | -- | -- | |
| Patel Paresh | $52,000 | -- | |
| Payne Barbara T | $94,000 | -- | |
| Phillips Gregory A | $98,000 | -- | |
| Waterwheel Properties Llc | -- | -- | |
| Rice Levi N | $51,900 | -- | |
| Bank Of New York Trustee | -- | -- | |
| Labossiere John | $76,000 | -- |
Source: Public Records
Mortgage History
| Date | Status | Borrower | Loan Amount |
|---|---|---|---|
| Previous Owner | Phillips Gregory A | $96,485 |
Source: Public Records
Tax History
| Year | Tax Paid | Tax Assessment Tax Assessment Total Assessment is a certain percentage of the fair market value that is determined by local assessors to be the total taxable value of land and additions on the property. | Land | Improvement |
|---|---|---|---|---|
| 2025 | $1,200 | $34,388 | $2,088 | $32,300 |
| 2024 | $813 | $22,814 | $2,088 | $20,726 |
| 2023 | $645 | $21,187 | $2,088 | $19,099 |
| 2022 | $580 | $19,479 | $2,088 | $17,391 |
| 2021 | $562 | $17,982 | $2,088 | $15,894 |
| 2020 | $569 | $18,016 | $2,088 | $15,928 |
| 2019 | $565 | $17,824 | $2,088 | $15,736 |
| 2018 | $565 | $17,824 | $2,088 | $15,736 |
| 2017 | $574 | $17,824 | $2,088 | $15,736 |
| 2016 | $565 | $17,824 | $2,088 | $15,736 |
| 2015 | $585 | $17,617 | $2,088 | $15,529 |
| 2014 | $595 | $17,618 | $2,088 | $15,530 |
| 2013 | -- | $17,955 | $2,088 | $15,867 |
Source: Public Records
Map
Nearby Homes
- 253 Stancil Dr
- 0 Stephen Dr Unit 10710969
- 0 Stephen Dr Unit 10710891
- 122 King St
- 0 Valley Dr Unit 10701357
- 27 Hilltop Ln
- 526 Poplar St
- 481 Collins Rd
- 704 Skyline Dr
- 9 Poplar St
- 59 Sunset Ln
- 207 Poplar Trail
- 372 Hilltop Way
- 926 Skyline Dr
- 93 Hickory Cir
- 288 Davis Ave
- 208 Cherry St
- 30 Moore Ave
- 820 Collier Rd
- 128 Branch St
Your Personal Tour Guide
Ask me questions while you tour the home.