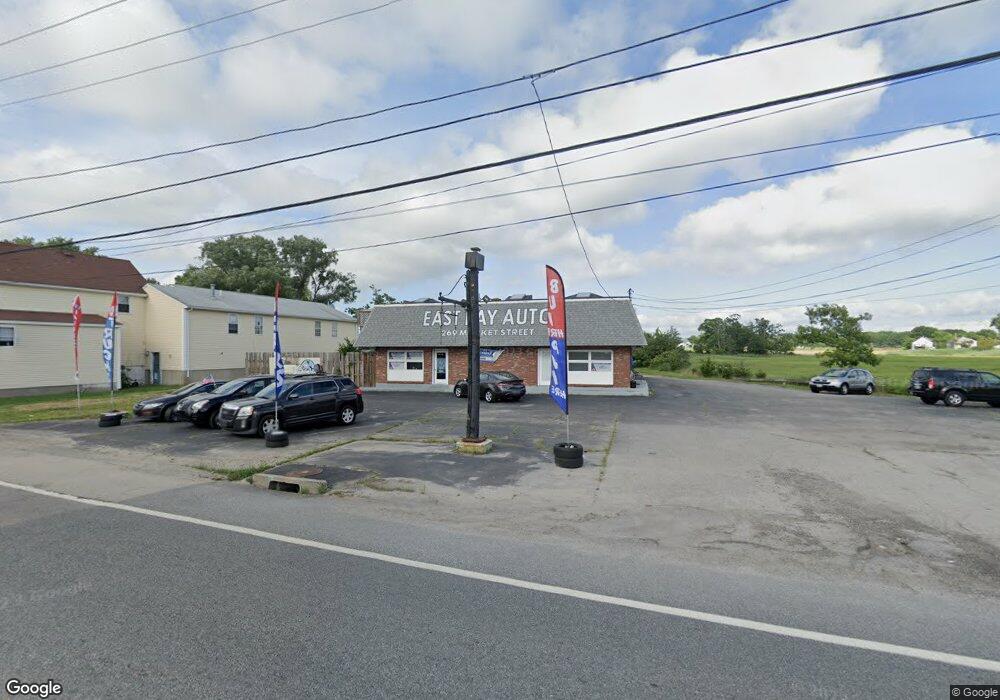
269 Market St Warren, RI 02885
North Warren NeighborhoodEstimated Value: $688,661
Studio
--
Bath
1,250
Sq Ft
$551/Sq Ft
Est. Value
About This Home
This home is located at 269 Market St, Warren, RI 02885 and is currently estimated at $688,661, approximately $550 per square foot. 269 Market St is a home located in Bristol County with nearby schools including Mt. Hope High School, Highlander Charter Middle and High School, and East Bay Career Academy.
Ownership History
Date
Name
Owned For
Owner Type
Purchase Details
Closed on
May 25, 2023
Sold by
Prouix Richard G
Bought by
Dilorenzo Peter
Current Estimated Value
Home Financials for this Owner
Home Financials are based on the most recent Mortgage that was taken out on this home.
Original Mortgage
$300,000
Outstanding Balance
$290,151
Interest Rate
6.27%
Mortgage Type
Purchase Money Mortgage
Estimated Equity
$398,510
Purchase Details
Closed on
Mar 6, 2018
Sold by
Proulx Richard A and Proulx Richard G
Bought by
Proulx Richard G
Create a Home Valuation Report for This Property
The Home Valuation Report is an in-depth analysis detailing your home's value as well as a comparison with similar homes in the area
Home Values in the Area
Average Home Value in this Area
Purchase History
| Date | Buyer | Sale Price | Title Company |
|---|---|---|---|
| Dilorenzo Peter | $550,000 | None Available | |
| Proulx Richard G | -- | -- |
Source: Public Records
Mortgage History
| Date | Status | Borrower | Loan Amount |
|---|---|---|---|
| Open | Dilorenzo Peter | $300,000 |
Source: Public Records
Tax History
| Year | Tax Paid | Tax Assessment Tax Assessment Total Assessment is a certain percentage of the fair market value that is determined by local assessors to be the total taxable value of land and additions on the property. | Land | Improvement |
|---|---|---|---|---|
| 2025 | $6,252 | $419,900 | $169,700 | $250,200 |
| 2024 | $6,063 | $419,900 | $169,700 | $250,200 |
| 2023 | $5,736 | $419,900 | $169,700 | $250,200 |
| 2022 | $5,635 | $312,900 | $148,000 | $164,900 |
| 2021 | $5,545 | $312,900 | $148,000 | $164,900 |
| 2020 | $5,432 | $312,900 | $148,000 | $164,900 |
| 2019 | $5,626 | $294,400 | $137,600 | $156,800 |
| 2018 | $5,552 | $294,400 | $137,600 | $156,800 |
| 2017 | $5,538 | $294,400 | $137,600 | $156,800 |
| 2016 | $5,765 | $288,700 | $131,900 | $156,800 |
| 2015 | $5,765 | $288,700 | $131,900 | $156,800 |
| 2014 | $5,794 | $288,700 | $131,900 | $156,800 |
Source: Public Records
Map
Nearby Homes
- 271 Market St
- 273 Market St
- 272 Market St
- 274 Market St
- 275 Market St
- 0 Orange St
- 277 Market St
- 4 John St Unit 1
- 4 John St Unit 2
- 4 John St Unit A
- 4 John St Unit B
- 276 Market St
- 279 Market St
- 249 Market St
- 242 Market St
- 242 Market St Unit 2
- 278 Market St
- 281 Market St
- 13 Kickemuit Rd
- 24 Kickemuit Rd
Your Personal Tour Guide
Ask me questions while you tour the home.