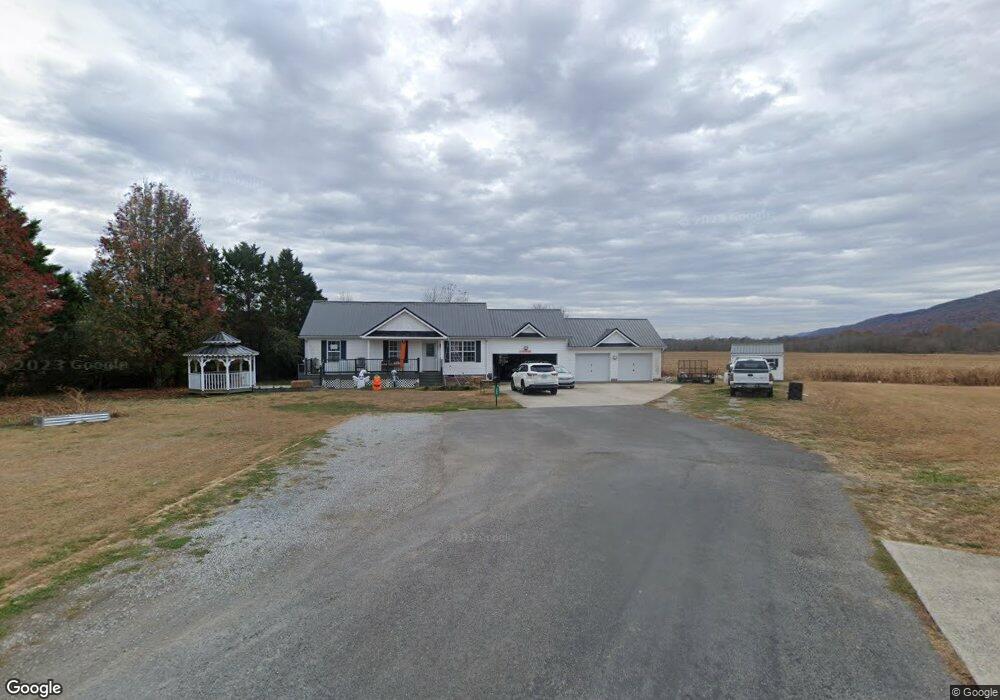
269 Mill Run Dunlap, TN 37327
Estimated Value: $258,351 - $329,000
3
Beds
2
Baths
1,189
Sq Ft
$243/Sq Ft
Est. Value
About This Home
This home is located at 269 Mill Run, Dunlap, TN 37327 and is currently estimated at $288,588, approximately $242 per square foot. 269 Mill Run is a home located in Sequatchie County with nearby schools including Griffith Elementary School, Sequatchie County Middle School, and Sequatchie County High School.
Ownership History
Date
Name
Owned For
Owner Type
Purchase Details
Closed on
Jan 22, 2021
Sold by
Barrett Marion Ballard
Bought by
Goff Rocky W
Current Estimated Value
Home Financials for this Owner
Home Financials are based on the most recent Mortgage that was taken out on this home.
Original Mortgage
$202,020
Outstanding Balance
$179,476
Interest Rate
2.71%
Mortgage Type
New Conventional
Estimated Equity
$109,112
Purchase Details
Closed on
Aug 7, 2006
Sold by
Grant James R
Bought by
Barrett David G
Home Financials for this Owner
Home Financials are based on the most recent Mortgage that was taken out on this home.
Original Mortgage
$89,000
Interest Rate
6.6%
Purchase Details
Closed on
Jun 6, 2006
Bought by
Barrett David G
Purchase Details
Closed on
Apr 23, 1999
Bought by
Land Keith Land George
Purchase Details
Closed on
Apr 18, 1996
Purchase Details
Closed on
Mar 3, 1992
Bought by
Ewton Justine B and Husband James A
Create a Home Valuation Report for This Property
The Home Valuation Report is an in-depth analysis detailing your home's value as well as a comparison with similar homes in the area
Home Values in the Area
Average Home Value in this Area
Purchase History
| Date | Buyer | Sale Price | Title Company |
|---|---|---|---|
| Goff Rocky W | $200,000 | None Available | |
| Barrett David G | $89,000 | -- | |
| Barrett David G | -- | -- | |
| Land Keith Land George | $65,000 | -- | |
| -- | $45,000 | -- | |
| Ewton Justine B | $34,000 | -- |
Source: Public Records
Mortgage History
| Date | Status | Borrower | Loan Amount |
|---|---|---|---|
| Open | Goff Rocky W | $202,020 | |
| Previous Owner | Ewton Justine B | $89,000 |
Source: Public Records
Tax History
| Year | Tax Paid | Tax Assessment Tax Assessment Total Assessment is a certain percentage of the fair market value that is determined by local assessors to be the total taxable value of land and additions on the property. | Land | Improvement |
|---|---|---|---|---|
| 2025 | $1,017 | $55,400 | $3,750 | $51,650 |
| 2024 | $1,017 | $55,400 | $3,750 | $51,650 |
| 2023 | $1,017 | $55,400 | $3,750 | $51,650 |
| 2022 | $825 | $33,800 | $3,050 | $30,750 |
| 2021 | $825 | $33,800 | $3,050 | $30,750 |
| 2020 | $818 | $33,500 | $3,050 | $30,450 |
| 2019 | $818 | $33,500 | $3,050 | $30,450 |
| 2018 | $818 | $33,500 | $3,050 | $30,450 |
| 2017 | $818 | $33,500 | $3,050 | $30,450 |
| 2016 | $867 | $33,750 | $3,050 | $30,700 |
| 2015 | $867 | $33,750 | $3,050 | $30,700 |
| 2014 | $721 | $28,075 | $3,050 | $25,025 |
Source: Public Records
Map
Nearby Homes
- 132 Galloway Airport Rd
- 108 Galloway Airport Rd
- 220 Little Ponderosa Trail
- 33 John Burch Rd W
- 0 John Burch Rd Unit RTC2705187
- 0 John Burch Rd Unit A 1395827
- 74 Hardin Rd
- 0 Hardin Rd Unit 1523572
- 0 Hardin Rd Unit 1321169
- 5 Treeline Dr
- 4 Treeline Dr
- 0 Treeline Dr Unit 1510685
- 0 Treeline Dr Unit RTC2815537
- 0 Treeline Dr Unit 1510684
- 0 Treeline Dr Unit RTC2815536
- 67 Shady Oaks Cove
- 0 Shady Oaks Cove Unit 1525918
- 438 Highland Dr
- 919 John Burch Rd
- 347 Highland Dr
- 269 Mill Run Rd
- 266 Mill Run
- 264 Galloway Airport Rd
- 264 Galloway Airport Rd Unit Lot 1
- 257 Mill Run
- 257 Mill Run Rd
- 256 Mill Rd
- 256 Mill Run
- 256 Mill Run Rd
- 293 Beaver Creek Rd
- 239 Mill Run
- 293 Beaver Creek Rd
- 256 Beaver Creek Rd
- 239 Mill Run Rd
- 279 Beaver Creek Rd
- 234 Mill Run
- 259 Beaver Creek Rd
- 252 Beaver Creek Rd
- 259 Beaver Creek Rd
- 215 Mill Run
Your Personal Tour Guide
Ask me questions while you tour the home.