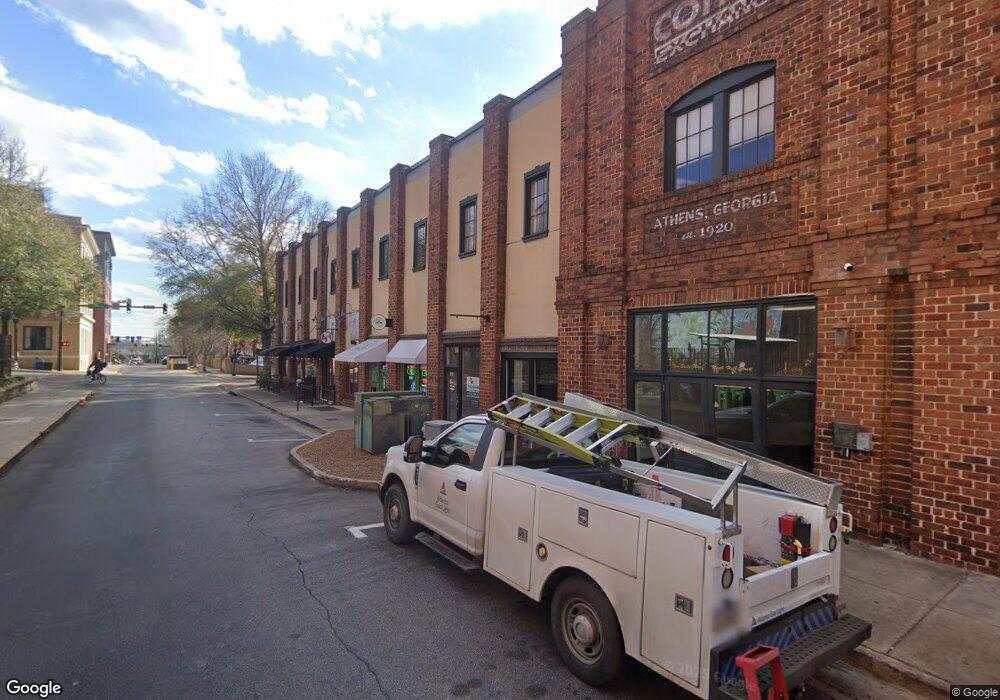
269 N Hull St Unit 300 Athens, GA 30601
Estimated Value: $4,431,000
--
Bed
--
Bath
17,920
Sq Ft
$247/Sq Ft
Est. Value
About This Home
This home is located at 269 N Hull St Unit 300, Athens, GA 30601 and is currently priced at $4,431,000, approximately $247 per square foot. 269 N Hull St Unit 300 is a home located in Clarke County with nearby schools including Barrow Elementary School, Clarke Middle School, and Clarke Central High School.
Ownership History
Date
Name
Owned For
Owner Type
Purchase Details
Closed on
Aug 31, 2025
Sold by
Athens Arches Llc
Bought by
Five Athens Property Llc
Current Estimated Value
Purchase Details
Closed on
Apr 25, 2014
Sold by
Athvest Llc
Bought by
Hawkshead Properties Llc
Purchase Details
Closed on
Dec 13, 2013
Sold by
Athens Arches Llc
Bought by
Graymad Llc
Purchase Details
Closed on
Jul 31, 2013
Sold by
Athens Arches Llc
Bought by
Sibilsky David Cordell
Purchase Details
Closed on
Jul 19, 2013
Sold by
Athens Arches Llc
Bought by
Ew3 Llc
Purchase Details
Closed on
Jul 18, 2013
Sold by
Athens Arches Llc
Bought by
Jens214 Llc
Purchase Details
Closed on
Jul 17, 2013
Sold by
Athens Arches Llc
Bought by
Athvest Llc
Purchase Details
Closed on
Oct 1, 2002
Sold by
Dupree Brian C Roger P Glass J
Bought by
Athens Arches Llc
Purchase Details
Closed on
Aug 20, 2002
Sold by
Winder Mfg Co
Bought by
Dupree Brian C Roger P Glass Joseph
Create a Home Valuation Report for This Property
The Home Valuation Report is an in-depth analysis detailing your home's value as well as a comparison with similar homes in the area
Home Values in the Area
Average Home Value in this Area
Purchase History
| Date | Buyer | Sale Price | Title Company |
|---|---|---|---|
| Five Athens Property Llc | $1,425,000 | -- | |
| Five Athens Property Llc | $1,425,000 | -- | |
| Hawkshead Properties Llc | $175,000 | -- | |
| Hawkshead Properties Llc | $175,000 | -- | |
| Graymad Llc | $142,500 | -- | |
| Graymad Llc | $142,500 | -- | |
| Sibilsky David Cordell | $110,500 | -- | |
| Polaneczky Joseph G | $108,640 | -- | |
| Sibilsky David Cordell | $110,500 | -- | |
| Polaneczky Joseph G | $108,640 | -- | |
| Ew3 Llc | $1,120,000 | -- | |
| Ew3 Llc | $1,120,000 | -- | |
| Jens214 Llc | $146,000 | -- | |
| Jens206 Llc | $146,000 | -- | |
| Jens214 Llc | $146,000 | -- | |
| Jens206 Llc | $146,000 | -- | |
| Athvest Llc | $149,900 | -- | |
| Athvest Llc | $149,900 | -- | |
| Athens Arches Llc | -- | -- | |
| Athens Arches Llc | -- | -- | |
| Dupree Brian C Roger P Glass Joseph | $1,600,000 | -- | |
| Dupree Brian C Roger P Glass Joseph | $1,600,000 | -- |
Source: Public Records
Tax History Compared to Growth
Tax History
| Year | Tax Paid | Tax Assessment Tax Assessment Total Assessment is a certain percentage of the fair market value that is determined by local assessors to be the total taxable value of land and additions on the property. | Land | Improvement |
|---|---|---|---|---|
| 2024 | $54,423 | $1,687,526 | $890,332 | $797,194 |
| 2023 | $54,423 | $1,687,526 | $890,332 | $797,194 |
| 2022 | $54,404 | $1,653,627 | $890,332 | $763,295 |
| 2021 | $49,350 | $1,422,203 | $763,142 | $659,061 |
| 2020 | $46,359 | $1,336,002 | $699,546 | $636,456 |
| 2019 | $44,930 | $1,285,562 | $699,546 | $586,016 |
| 2018 | $39,980 | $1,143,917 | $635,952 | $507,965 |
| 2017 | $39,046 | $1,117,189 | $635,952 | $481,237 |
| 2016 | $39,046 | $1,117,188 | $635,951 | $481,237 |
| 2015 | $34,781 | $993,738 | $508,761 | $484,976 |
| 2014 | $34,831 | $993,738 | $508,761 | $484,977 |
Source: Public Records
Map
Nearby Homes
- 269 N Hull St Unit 212
- 250 W Broad St Unit 811
- 250 W Broad St Unit 521
- 100 Prince Ave Unit A404
- 100 Prince Ave Unit A407
- 559 Pulaski St
- 143 Barrow St
- 257 Hill St
- 600 Pulaski St
- 570 Prince Ave
- 365 S Church St Unit 1A, 1B, 1C
- 668 Pulaski St
- 494 Baxter St Unit 32
- 145 Hendrix Ave
- 500 Dearing St Unit 6
- 198 Flint St
- 597 Dearing St
- 239 Madison Heights
- 270 Atlanta Ave
- 1196 W Hancock Ave Unit 1
- 269 N Hull St Unit 205
- 269 N Hull St Unit 203
- 269 N Hull St Unit 216
- 269 N Hull St Unit 206
- 269 N Hull St Unit 214
- 269 N Hull St Unit 217
- 269 N Hull St Unit 210
- 269 N Hull St Unit ID1302850P
- 269 N Hull St Unit ID1247976P
- 269 N Hull St Unit 208
- 269 N Hull St Unit 207
- 269 N Hull St Unit 213
- 269 N Hull St Unit 400
- 269 N Hull St Unit 211
- 269 N Hull St Unit 201
- 269 N Hull St Unit 204
- 269 N Hull St
- 269 N Hull St Unit 200
- 269 N Hull St Unit 215
- 269 N Hull St Unit 209