269 S 320 W Tooele, UT 84074
Estimated Value: $295,000 - $332,000
--
Bed
--
Bath
884
Sq Ft
$355/Sq Ft
Est. Value
About This Home
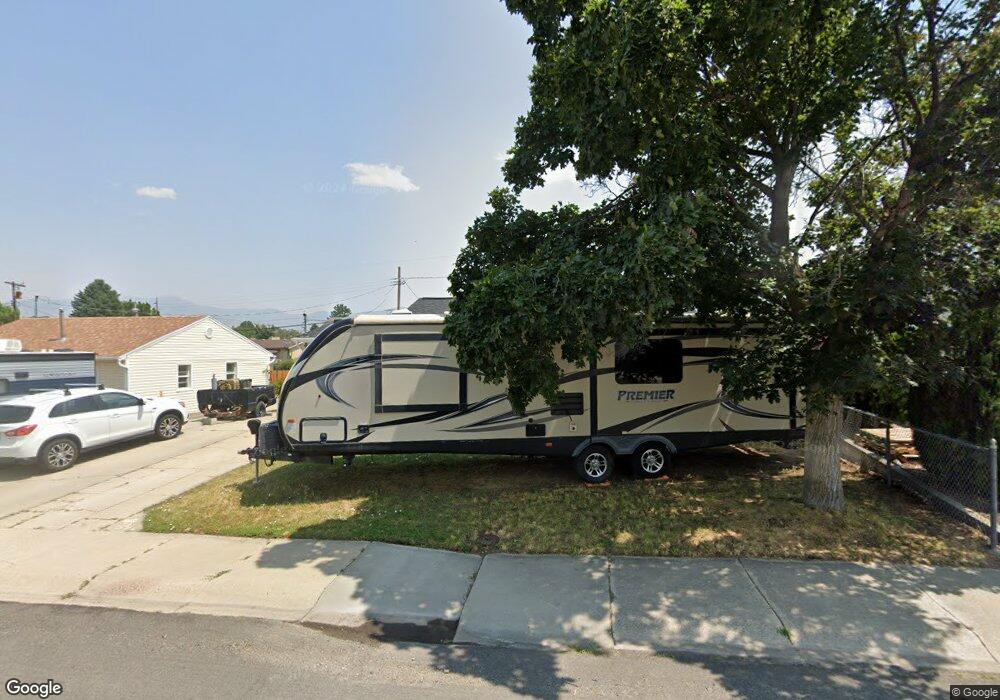
This home is located at 269 S 320 W, Tooele, UT 84074 and is currently estimated at $313,597, approximately $354 per square foot. 269 S 320 W is a home located in Tooele County with nearby schools including West Elementary School, Northlake Elementary School, and Tooele Junior High School.
Ownership History
Date
Name
Owned For
Owner Type
Purchase Details
Closed on
Oct 25, 2007
Sold by
Henwood Jospeh Lynn and Smith Kristeen
Bought by
Henwood Jospeh Lynn and Jospeh Lynn Henwood Family Trust
Current Estimated Value
Purchase Details
Closed on
May 10, 2005
Sold by
Henwood Joseph Lynn and Henwood Jacquelyn
Bought by
Henwood Joseph Lynn and Henwood Jacquelyn
Purchase Details
Closed on
May 9, 2005
Sold by
Henwood Joseph Lynn and Henwood Jacquelyn
Bought by
Henwood Joseph Lynn and Henwood Jacquelyn
Create a Home Valuation Report for This Property
The Home Valuation Report is an in-depth analysis detailing your home's value as well as a comparison with similar homes in the area
Home Values in the Area
Average Home Value in this Area
Purchase History
| Date | Buyer | Sale Price | Title Company |
|---|---|---|---|
| Henwood Jospeh Lynn | -- | Intergrated Title Insurance | |
| Henwood Joseph Lynn | -- | None Available | |
| Henwood Joseph Lynn | -- | None Available |
Source: Public Records
Tax History Compared to Growth
Tax History
| Year | Tax Paid | Tax Assessment Tax Assessment Total Assessment is a certain percentage of the fair market value that is determined by local assessors to be the total taxable value of land and additions on the property. | Land | Improvement |
|---|---|---|---|---|
| 2025 | $2,081 | $315,606 | $80,300 | $235,306 |
| 2024 | $222 | $164,651 | $44,165 | $120,486 |
| 2023 | $222 | $181,089 | $43,064 | $138,025 |
| 2022 | $1,606 | $138,152 | $54,120 | $84,032 |
| 2021 | $1,335 | $96,103 | $36,080 | $60,023 |
| 2020 | $1,168 | $145,758 | $36,625 | $109,133 |
| 2019 | $1,092 | $134,065 | $36,625 | $97,440 |
| 2018 | $954 | $111,125 | $35,000 | $76,125 |
| 2017 | $888 | $122,707 | $30,000 | $92,707 |
| 2016 | $750 | $60,838 | $16,500 | $44,338 |
| 2015 | $750 | $54,533 | $0 | $0 |
| 2014 | -- | $54,533 | $0 | $0 |
Source: Public Records
Map
Nearby Homes