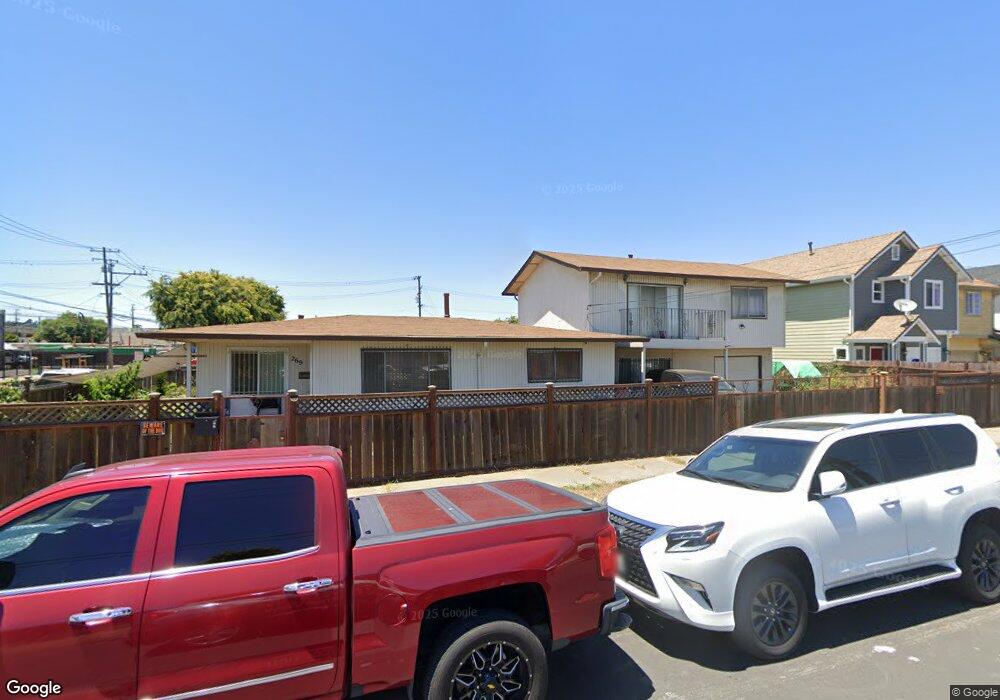
269 S 3rd St Richmond, CA 94804
Santa Fe NeighborhoodEstimated Value: $490,000 - $624,384
4
Beds
3
Baths
1,730
Sq Ft
$315/Sq Ft
Est. Value
About This Home
This home is located at 269 S 3rd St, Richmond, CA 94804 and is currently estimated at $544,096, approximately $314 per square foot. 269 S 3rd St is a home located in Contra Costa County with nearby schools including Nystrom Elementary School, Lovonya DeJean Middle School, and John F. Kennedy High School.
Ownership History
Date
Name
Owned For
Owner Type
Purchase Details
Closed on
Mar 1, 2017
Sold by
Russell Ralph J
Bought by
Russell Ralph J
Current Estimated Value
Purchase Details
Closed on
Jul 15, 2015
Sold by
Russell Ralph J
Bought by
Russell Ralph J
Home Financials for this Owner
Home Financials are based on the most recent Mortgage that was taken out on this home.
Original Mortgage
$397,500
Interest Rate
3.27%
Mortgage Type
Reverse Mortgage Home Equity Conversion Mortgage
Purchase Details
Closed on
Nov 14, 2013
Sold by
Bobo Ruth E and Russell Ralph J
Bought by
Russell Ralph J
Create a Home Valuation Report for This Property
The Home Valuation Report is an in-depth analysis detailing your home's value as well as a comparison with similar homes in the area
Home Values in the Area
Average Home Value in this Area
Purchase History
| Date | Buyer | Sale Price | Title Company |
|---|---|---|---|
| Russell Ralph J | -- | None Available | |
| Russell Ralph J | -- | Placer Title Company | |
| Russell Ralph J | -- | None Available |
Source: Public Records
Mortgage History
| Date | Status | Borrower | Loan Amount |
|---|---|---|---|
| Closed | Russell Ralph J | $397,500 |
Source: Public Records
Tax History Compared to Growth
Tax History
| Year | Tax Paid | Tax Assessment Tax Assessment Total Assessment is a certain percentage of the fair market value that is determined by local assessors to be the total taxable value of land and additions on the property. | Land | Improvement |
|---|---|---|---|---|
| 2025 | $3,799 | $98,598 | $15,851 | $82,747 |
| 2024 | $3,656 | $96,666 | $15,541 | $81,125 |
| 2023 | $3,656 | $94,772 | $15,237 | $79,535 |
| 2022 | $3,203 | $92,915 | $14,939 | $77,976 |
| 2021 | $3,734 | $91,095 | $14,647 | $76,448 |
| 2019 | $3,211 | $88,395 | $14,213 | $74,182 |
| 2018 | $2,756 | $86,663 | $13,935 | $72,728 |
| 2017 | $2,381 | $84,964 | $13,662 | $71,302 |
| 2016 | $2,520 | $83,299 | $13,395 | $69,904 |
| 2015 | $2,171 | $82,048 | $13,194 | $68,854 |
| 2014 | $2,158 | $80,442 | $12,936 | $67,506 |
Source: Public Records
Map
Nearby Homes