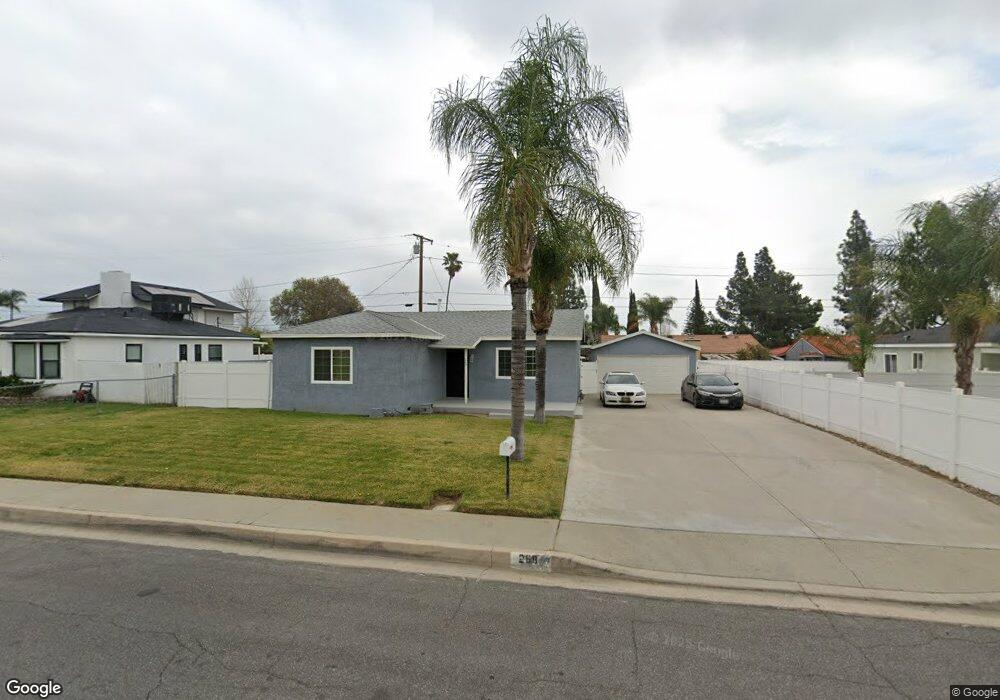
269 S Rexford St Rialto, CA 92376
Rancho West NeighborhoodEstimated Value: $479,472 - $560,000
4
Beds
1
Bath
1,253
Sq Ft
$411/Sq Ft
Est. Value
About This Home
This home is located at 269 S Rexford St, Rialto, CA 92376 and is currently estimated at $515,118, approximately $411 per square foot. 269 S Rexford St is a home located in San Bernardino County with nearby schools including Kelley Elementary School, William G. Jehue Middle School, and Rialto High School.
Ownership History
Date
Name
Owned For
Owner Type
Purchase Details
Closed on
Jun 15, 2001
Sold by
Mejia Urbano
Bought by
Mejia Marco Antonio
Current Estimated Value
Home Financials for this Owner
Home Financials are based on the most recent Mortgage that was taken out on this home.
Original Mortgage
$81,000
Outstanding Balance
$30,854
Interest Rate
7.14%
Estimated Equity
$484,264
Purchase Details
Closed on
Aug 24, 1994
Sold by
Mejia Rosa Elena
Bought by
Mejia Urbano
Home Financials for this Owner
Home Financials are based on the most recent Mortgage that was taken out on this home.
Original Mortgage
$79,908
Interest Rate
8.65%
Mortgage Type
FHA
Purchase Details
Closed on
Jul 27, 1994
Sold by
Briggs Virginia and Briggs Virginia
Bought by
Mejia Marco Antonio and Mejia Urbano
Home Financials for this Owner
Home Financials are based on the most recent Mortgage that was taken out on this home.
Original Mortgage
$79,908
Interest Rate
8.65%
Mortgage Type
FHA
Create a Home Valuation Report for This Property
The Home Valuation Report is an in-depth analysis detailing your home's value as well as a comparison with similar homes in the area
Home Values in the Area
Average Home Value in this Area
Purchase History
| Date | Buyer | Sale Price | Title Company |
|---|---|---|---|
| Mejia Marco Antonio | -- | Fidelity National Title Co | |
| Mejia Urbano | -- | Commonwealth Land Title Co | |
| Mejia Marco Antonio | $80,000 | Commonwealth Land Title Co |
Source: Public Records
Mortgage History
| Date | Status | Borrower | Loan Amount |
|---|---|---|---|
| Open | Mejia Marco Antonio | $81,000 | |
| Closed | Mejia Marco Antonio | $79,908 |
Source: Public Records
Tax History Compared to Growth
Tax History
| Year | Tax Paid | Tax Assessment Tax Assessment Total Assessment is a certain percentage of the fair market value that is determined by local assessors to be the total taxable value of land and additions on the property. | Land | Improvement |
|---|---|---|---|---|
| 2025 | $1,844 | $139,739 | $50,554 | $89,185 |
| 2024 | $1,844 | $136,999 | $49,563 | $87,436 |
| 2023 | $1,951 | $134,313 | $48,591 | $85,722 |
| 2022 | $1,818 | $131,679 | $47,638 | $84,041 |
| 2021 | $1,802 | $129,097 | $46,704 | $82,393 |
| 2020 | $1,809 | $127,773 | $46,225 | $81,548 |
| 2019 | $1,771 | $125,268 | $45,319 | $79,949 |
| 2018 | $1,723 | $122,811 | $44,430 | $78,381 |
| 2017 | $1,707 | $120,403 | $43,559 | $76,844 |
| 2016 | $1,685 | $118,042 | $42,705 | $75,337 |
| 2015 | $1,543 | $116,269 | $42,064 | $74,205 |
| 2014 | $1,450 | $113,991 | $41,240 | $72,751 |
Source: Public Records
Map
Nearby Homes
- 2865 W Rialto Ave Unit 17
- 160 S Eucalyptus Ave
- 2930 W Rialto Ave Unit 44
- 565 S Pampas Ave
- 456 E Wilson St
- 114 S Encina Ave
- 135 N Pepper Ave Unit 9
- 645 E King St
- 114 S Acacia Ave
- 127 S Joyce Ave
- 2744 W Rialto Ave Unit 15
- 109 S Joyce Ave
- 484 S Joyce Ave
- 565 S Joyce Ave
- 190 N Meridian Ave
- 190 N Meridian Ave Unit 66
- 2686 W Mill St Unit 133
- 2686 W Mill St Unit 91
- 2618 W Via San Carlos
- 2610 W Via San Carlos
- 279 S Rexford St
- 263 S Rexford St
- 272 S Lamarr St
- 274 S Lamarr St
- 264 S Lamarr St
- 287 S Rexford St
- 257 S Rexford St
- 270 S Rexford St
- 280 S Lamarr St
- 280 S Rexford St
- 264 S Rexford St
- 258 S Lamarr St
- 258 S Rexford St
- 288 S Rexford St
- 249 S Rexford St
- 2974 W Birch St
- 271 S Tamarisk Ave
- 271 S Lamarr St
- 250 S Lamarr St
- 279 S Tamarisk Ave