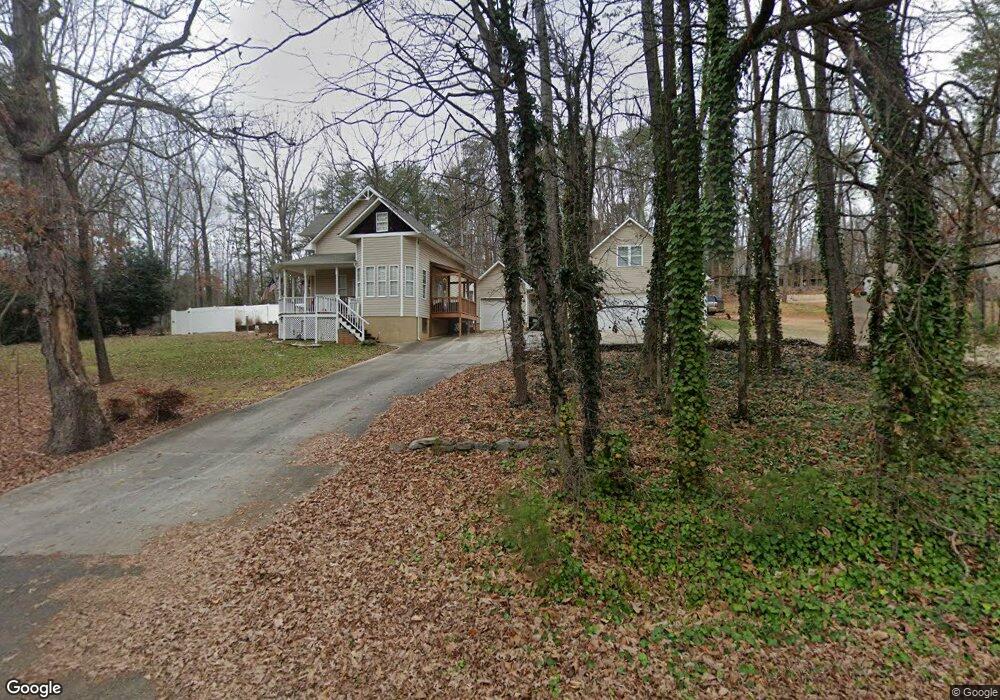
2690 Mountainview Rd Clover, SC 29710
Estimated Value: $347,000 - $389,000
Studio
--
Bath
1,518
Sq Ft
$240/Sq Ft
Est. Value
About This Home
This home is located at 2690 Mountainview Rd, Clover, SC 29710 and is currently estimated at $364,690, approximately $240 per square foot. 2690 Mountainview Rd is a home located in York County with nearby schools including Bethel Elementary School, Oakridge Middle School, and Clover High School.
Ownership History
Date
Name
Owned For
Owner Type
Purchase Details
Closed on
Mar 30, 2010
Sold by
Secretary Of Veterans Affairs
Bought by
Johnson Charles Ray
Current Estimated Value
Home Financials for this Owner
Home Financials are based on the most recent Mortgage that was taken out on this home.
Original Mortgage
$159,065
Outstanding Balance
$105,063
Interest Rate
4.99%
Mortgage Type
FHA
Estimated Equity
$259,627
Purchase Details
Closed on
Dec 15, 2009
Sold by
Shonebarger Brandon Leo
Bought by
Secretary Of Veterans Affairs
Purchase Details
Closed on
Nov 20, 2007
Sold by
Jackson Clifton Scotty Allen and Jackson Clifton Shawna
Bought by
Shonebarger Brandon Leo
Home Financials for this Owner
Home Financials are based on the most recent Mortgage that was taken out on this home.
Original Mortgage
$243,712
Interest Rate
6.29%
Mortgage Type
VA
Purchase Details
Closed on
Sep 30, 1999
Sold by
Pentleton & Son Homes Inc
Bought by
Clifton Scotty A
Create a Home Valuation Report for This Property
The Home Valuation Report is an in-depth analysis detailing your home's value as well as a comparison with similar homes in the area
Home Values in the Area
Average Home Value in this Area
Purchase History
| Date | Buyer | Sale Price | Title Company |
|---|---|---|---|
| Johnson Charles Ray | $162,000 | -- | |
| Secretary Of Veterans Affairs | $179,785 | -- | |
| Shonebarger Brandon Leo | $238,000 | Attorney | |
| Clifton Scotty A | $138,500 | -- |
Source: Public Records
Mortgage History
| Date | Status | Borrower | Loan Amount |
|---|---|---|---|
| Open | Johnson Charles Ray | $159,065 | |
| Previous Owner | Shonebarger Brandon Leo | $243,712 |
Source: Public Records
Tax History
| Year | Tax Paid | Tax Assessment Tax Assessment Total Assessment is a certain percentage of the fair market value that is determined by local assessors to be the total taxable value of land and additions on the property. | Land | Improvement |
|---|---|---|---|---|
| 2025 | $1,228 | $8,967 | $2,245 | $6,722 |
| 2024 | $1,102 | $7,797 | $2,064 | $5,733 |
| 2023 | $1,130 | $7,797 | $2,064 | $5,733 |
| 2022 | $931 | $7,797 | $2,064 | $5,733 |
| 2021 | -- | $7,797 | $2,064 | $5,733 |
| 2020 | $883 | $7,797 | $0 | $0 |
| 2019 | $837 | $6,780 | $0 | $0 |
| 2018 | $841 | $6,780 | $0 | $0 |
| 2017 | $784 | $6,780 | $0 | $0 |
| 2016 | $738 | $6,780 | $0 | $0 |
| 2014 | $882 | $6,780 | $1,280 | $5,500 |
| 2013 | $882 | $7,740 | $1,280 | $6,460 |
Source: Public Records
Map
Nearby Homes
- 6575 Charlotte Hwy
- 6396 Crosswinds Dr
- 00 Charlotte Hwy
- 5304 W Liberty Hill Rd
- 000 Old Charlotte Hwy Unit 43
- 7035 Twin Streams Ln
- 1129 Black Walnut Rd
- 1541 Hedge Apple Rd
- 1141 Black Walnut Rd
- 2766 Baird Rd
- 1440 Imperial Ct
- 379 Kentmere Ln
- 2 Pinnacle Way Unit Nottingham
- 2 Pinnacle Way Unit Augusta
- 2 Pinnacle Way Unit Covington
- 4 Pinnacle Way Unit Hawthorne
- 4 Pinnacle Way Unit Savannah
- 4 Pinnacle Way Unit Devonshire
- 2005 Brightflower Ln
- 4083 Home Grown Way
- 2731 Mountainview Rd Unit 2
- 2731 Mountainview Rd
- 2680 Mountainview Rd
- 2689 Mountainview Rd
- 6488 Crosswinds Dr
- 6493 Crosswinds Dr
- 6465 Crosswinds Dr
- 6556 Charlotte Hwy
- 6303 Crosswinds Dr
- 6539 Charlotte Hwy
- 2620 Mountainview Rd Unit 7
- 6588 Charlotte Hwy
- 6311 Crosswinds Dr
- 6557 Charlotte Hwy
- 6453 Crosswinds Dr
- 6325 Crosswinds Dr
- 6490 Charlotte Hwy
- 6310 Crosswinds Dr
- 2793 Mountainview Rd
- 5687 W Liberty Hill Rd
Your Personal Tour Guide
Ask me questions while you tour the home.