


2692 Northwold Rd Columbus, OH 43231
Brandywine NeighborhoodEstimated payment $1,394/month
Highlights
- Very Popular Property
- Vaulted Ceiling
- No HOA
- Westerville South High School Rated A-
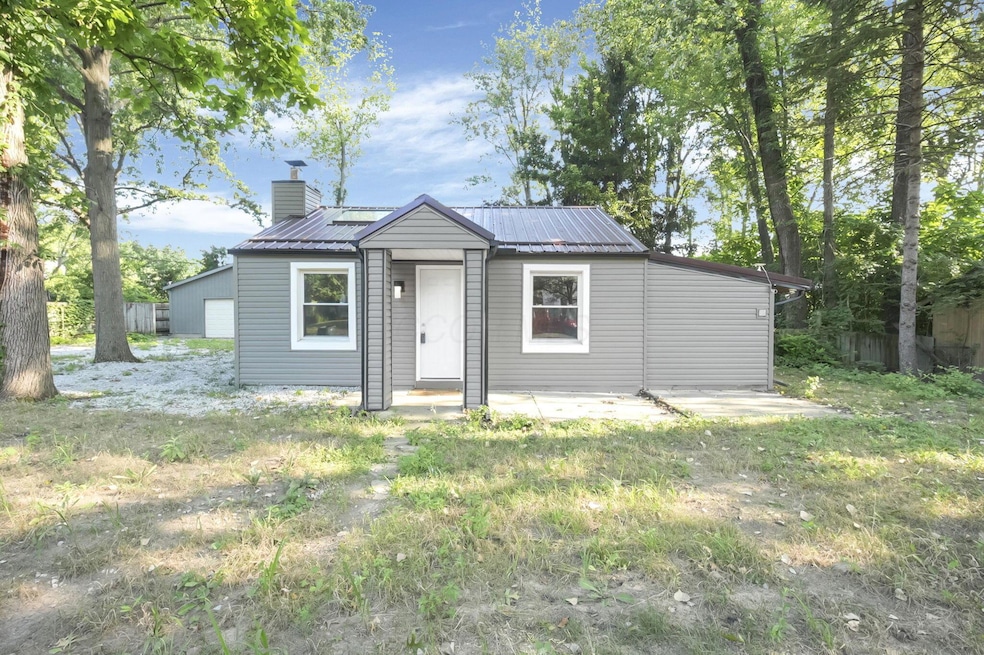
- Ranch Style House
- 3 Car Detached Garage
About This Home
City water added July 2025 ($12k upgrade). $2500 worth of new landscaping! Completely updated ranch home including all bedrooms! New flooring/paint/siding/appliances. Nothing needed... just move in and make it yours. Nice neutral colors, white woodwork, vaulted great room lives large. Renovated bath. Very large garage. NOTE: Photos do not reflect new landscaping, sorry-
Home Details
Home Type
- Single Family
Est. Annual Taxes
- $2,473
Year Built
- Built in 1955
Lot Details
- 10,019 Sq Ft Lot
Parking
- 3 Car Detached Garage
- Garage Door Opener
Home Design
- Ranch Style House
- Block Foundation
- Vinyl Siding
Interior Spaces
- 1,080 Sq Ft Home
- Vaulted Ceiling
- Insulated Windows
- Carpet
- Crawl Space
- Laundry on main level
Kitchen
- Gas Range
- Microwave
Bedrooms and Bathrooms
- 3 Main Level Bedrooms
- 1 Full Bathroom
Utilities
- Forced Air Heating and Cooling System
- Heating System Uses Gas
- Gas Water Heater
Community Details
- No Home Owners Association
Listing and Financial Details
- Assessor Parcel Number 600-188143
Map
Home Values in the Area
Average Home Value in this Area
Tax History
| Year | Tax Paid | Tax Assessment Tax Assessment Total Assessment is a certain percentage of the fair market value that is determined by local assessors to be the total taxable value of land and additions on the property. | Land | Improvement |
|---|---|---|---|---|
| 2024 | $2,473 | $59,430 | $22,330 | $37,100 |
| 2023 | $2,503 | $59,430 | $22,330 | $37,100 |
| 2022 | $2,112 | $41,900 | $14,740 | $27,160 |
| 2021 | $2,133 | $41,900 | $14,740 | $27,160 |
| 2020 | $2,125 | $41,900 | $14,740 | $27,160 |
| 2019 | $1,739 | $34,620 | $12,290 | $22,330 |
| 2018 | $1,412 | $34,620 | $12,290 | $22,330 |
| 2017 | $1,413 | $34,620 | $12,290 | $22,330 |
| 2016 | $1,122 | $24,290 | $10,780 | $13,510 |
| 2015 | $1,125 | $24,290 | $10,780 | $13,510 |
| 2014 | $1,125 | $24,290 | $10,780 | $13,510 |
| 2013 | $1,212 | $25,550 | $11,340 | $14,210 |
Property History
| Date | Event | Price | Change | Sq Ft Price |
|---|---|---|---|---|
| 09/03/2025 09/03/25 | Price Changed | $225,000 | -2.2% | $208 / Sq Ft |
| 08/12/2025 08/12/25 | Price Changed | $230,000 | -2.1% | $213 / Sq Ft |
| 07/24/2025 07/24/25 | For Sale | $235,000 | -- | $218 / Sq Ft |
Purchase History
| Date | Type | Sale Price | Title Company |
|---|---|---|---|
| Sheriffs Deed | $201,000 | None Listed On Document | |
| Interfamily Deed Transfer | -- | None Available | |
| Deed | $61,500 | -- | |
| Deed | -- | -- | |
| Deed | -- | -- |
Mortgage History
| Date | Status | Loan Amount | Loan Type |
|---|---|---|---|
| Previous Owner | $100,600 | New Conventional | |
| Previous Owner | $109,250 | Unknown | |
| Previous Owner | $114,000 | Unknown | |
| Previous Owner | $84,000 | Unknown | |
| Previous Owner | $61,500 | New Conventional |
Source: Columbus and Central Ohio Regional MLS
MLS Number: 225027477
APN: 600-188143
Disclaimer: Certain information contained herein is derived from information provided by parties other than Homes.com. All information provided is deemed reliable, but is not guaranteed to be accurate and should be independently verified.
![]() IDX information is provided exclusively for personal, non-commercial use, and may not be used for any purpose other than to identify prospective properties consumers may be interested in purchasing.
IDX information is provided exclusively for personal, non-commercial use, and may not be used for any purpose other than to identify prospective properties consumers may be interested in purchasing.
Information is deemed reliable but not guaranteed.
- 2737 Northwold Rd
- 2903 Kilbourne Ave
- 0 Chester Rd
- 2559 Claridon Rd
- 0 Claridon Rd
- 0 Abington Rd Unit 224031739
- 0 Abington Rd Unit 224031738
- 0 Abington Rd Unit 224031704
- 0 Abington Rd Unit 224031699
- 2521 Claridon Rd
- 0 Ashbury Rd
- 2695 Kilbourne Ave
- 2568 Clybourne Rd
- 2558 Clybourne Rd
- 2918 Ironstone Dr
- 2965 Ironstone Dr
- 2594 Adda Ave
- 2588 Adda Ave
- 2582 Adda Ave
- 3084 Omega Dr
- 4589 Glenhaven Dr
- 2845 Morality Dr
- 2405 Edmonton Rd
- 4426 Calderwood Dr
- 4565 Northland Square Dr E
- 4333 Chesford Rd
- 3044 Bennington Ave
- 4301 Goldengate Oval
- 2750 Arbury Ct
- 4621 Northtowne Blvd
- 3252 Thornway Dr
- 4224 Concord Ln
- 4187 Beechwold Dr
- 2414 Timber Trail Dr N
- 2514 Mallard's Landing Dr
- 1900 Sunny Ct
- 4281 Walford St
- 5280 Tamarack Cir E
- 5050 Westerville Rd
- 4371 Belcher Ct
