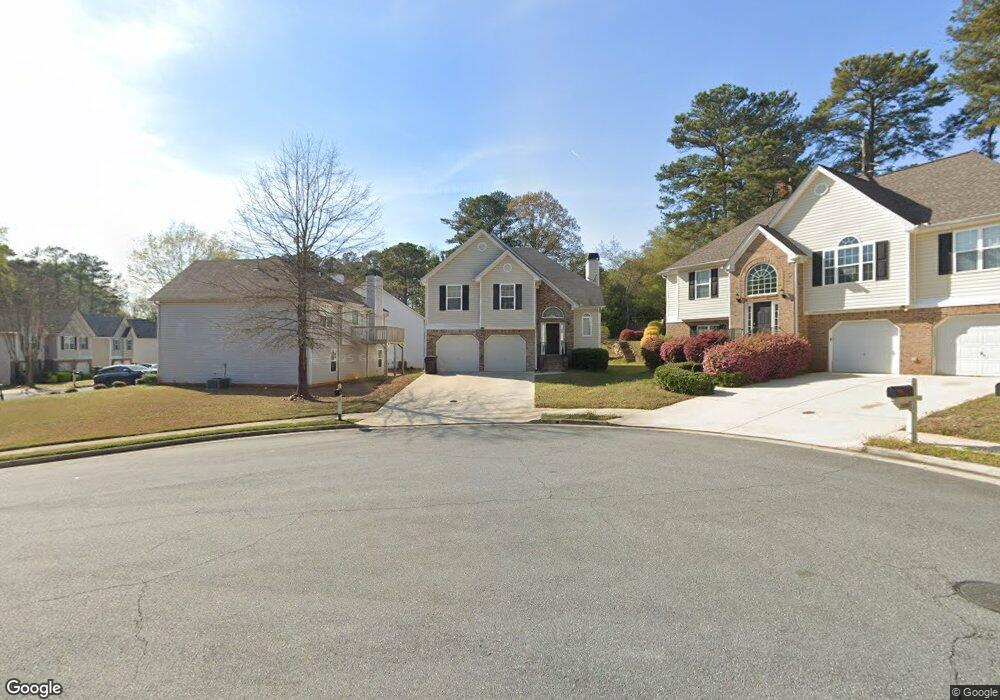
2692 Trellis Oaks Ct SW Marietta, GA 30060
Southwestern Marietta NeighborhoodEstimated Value: $385,338 - $409,000
4
Beds
3
Baths
1,589
Sq Ft
$250/Sq Ft
Est. Value
About This Home
This home is located at 2692 Trellis Oaks Ct SW, Marietta, GA 30060 and is currently estimated at $397,835, approximately $250 per square foot. 2692 Trellis Oaks Ct SW is a home located in Cobb County with nearby schools including Norton Park Elementary School, Floyd Middle School, and Osborne High School.
Ownership History
Date
Name
Owned For
Owner Type
Purchase Details
Closed on
Jul 7, 2016
Sold by
Ikpe Charity Nnenna
Bought by
Ikpe Charity Nnenna and Ikpe Chioma Hope
Current Estimated Value
Purchase Details
Closed on
Sep 20, 2006
Sold by
Red Oak Const Llc
Bought by
Ikpe Charity N
Home Financials for this Owner
Home Financials are based on the most recent Mortgage that was taken out on this home.
Original Mortgage
$170,800
Interest Rate
6.46%
Mortgage Type
New Conventional
Purchase Details
Closed on
Aug 24, 2005
Sold by
W & H Porperties Llc
Bought by
Red Oak Construction Llc
Home Financials for this Owner
Home Financials are based on the most recent Mortgage that was taken out on this home.
Original Mortgage
$169,600
Interest Rate
5.71%
Create a Home Valuation Report for This Property
The Home Valuation Report is an in-depth analysis detailing your home's value as well as a comparison with similar homes in the area
Home Values in the Area
Average Home Value in this Area
Purchase History
| Date | Buyer | Sale Price | Title Company |
|---|---|---|---|
| Ikpe Charity Nnenna | -- | -- | |
| Ikpe Charity N | $213,500 | -- | |
| Red Oak Construction Llc | $62,000 | -- |
Source: Public Records
Mortgage History
| Date | Status | Borrower | Loan Amount |
|---|---|---|---|
| Previous Owner | Ikpe Charity N | $170,800 | |
| Previous Owner | Red Oak Construction Llc | $169,600 |
Source: Public Records
Tax History Compared to Growth
Tax History
| Year | Tax Paid | Tax Assessment Tax Assessment Total Assessment is a certain percentage of the fair market value that is determined by local assessors to be the total taxable value of land and additions on the property. | Land | Improvement |
|---|---|---|---|---|
| 2025 | $3,797 | $153,992 | $24,000 | $129,992 |
| 2024 | $3,800 | $153,992 | $24,000 | $129,992 |
| 2023 | $3,257 | $153,992 | $24,000 | $129,992 |
| 2022 | $3,581 | $142,672 | $24,000 | $118,672 |
| 2021 | $2,569 | $96,468 | $20,000 | $76,468 |
| 2020 | $2,569 | $96,468 | $20,000 | $76,468 |
| 2019 | $2,569 | $96,468 | $20,000 | $76,468 |
| 2018 | $2,207 | $81,732 | $16,000 | $65,732 |
| 2017 | $2,093 | $81,732 | $16,000 | $65,732 |
| 2016 | $1,596 | $64,392 | $11,200 | $53,192 |
| 2015 | $1,637 | $64,392 | $11,200 | $53,192 |
| 2014 | $1,440 | $57,312 | $0 | $0 |
Source: Public Records
Map
Nearby Homes
- 51 Overbrook Dr SE Unit 3
- 33 Smyrna Powder Springs Rd SE
- 2896 Lakemont Dr SW
- 154 Timber Creek Ln SW Unit 1
- 2898 Lakemont Dr SW
- 244 Timber Creek Ln SW
- 174 Timber Creek Ln SW Unit 176
- 2777 Northwood Ct SW
- 85 Smyrna Powder Springs Rd SE
- 2896 Oshields Ct SW Unit 1
- 2621 Walton Way SW
- 187 Timber Creek Ln SW
- 2780 Northwood Ct SW
- 2946 Oshields Ct SW Unit 3
- 259 Diane Dr SE
- 264 Rockin Hill Dr SW
- 260 Diane Dr SE
- 2688 Trellis Oaks Ct SW
- 2713 Trellis Oaks Dr SW
- 2709 Trellis Oaks Dr SW
- 2709 Trellis Oaks Dr SW
- 2705 Trellis Oaks Dr SW
- 2684 Trellis Oaks Ct SW
- 2710 Trellis Oaks Dr SW
- 2714 Trellis Oaks Dr SW Unit 1274
- 2714 Trellis Oaks Dr SW
- 85 Smyrna Powder Springs Rd SW
- 2687 Trellis Oaks Ct SW
- 2683 Trellis Oaks Ct SW
- 2701 Trellis Oaks Dr SW
- 65 Smyrna Powder Springs Rd SW
- 2691 Trellis Oaks Ct SW
- 2718 Trellis Oaks Dr SW
- 2717 Trellis Oaks Dr SW
- 2706 Trellis Oaks Dr SW
- 2702 Trellis Oaks Dr SW
- 57 Smyrna Powder Springs Rd SW