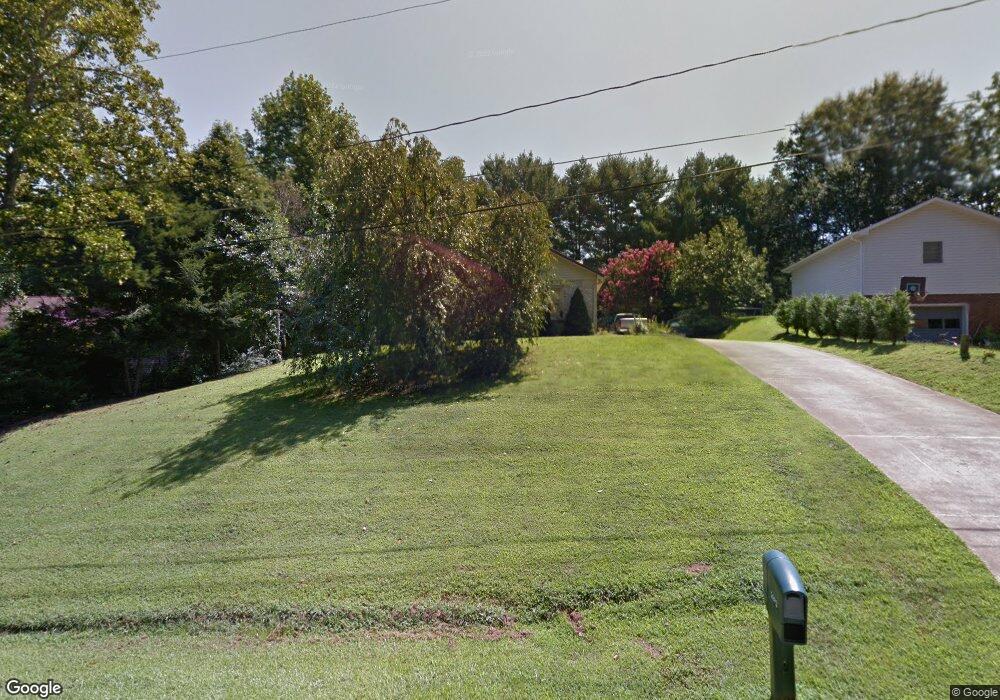
2693 Farmland Acres Morganton, NC 28655
Estimated Value: $251,935 - $297,000
3
Beds
2
Baths
1,360
Sq Ft
$198/Sq Ft
Est. Value
About This Home
This home is located at 2693 Farmland Acres, Morganton, NC 28655 and is currently estimated at $269,484, approximately $198 per square foot. 2693 Farmland Acres is a home located in Burke County with nearby schools including Drexel Elementary School, Heritage Middle School, and Jimmy C. Draughn High School.
Ownership History
Date
Name
Owned For
Owner Type
Purchase Details
Closed on
Apr 17, 2009
Sold by
Carswell Jane B
Bought by
Cross Jeffrey Allen and Cross Linda Kay
Current Estimated Value
Home Financials for this Owner
Home Financials are based on the most recent Mortgage that was taken out on this home.
Original Mortgage
$135,600
Outstanding Balance
$82,499
Interest Rate
4.25%
Mortgage Type
Purchase Money Mortgage
Estimated Equity
$186,985
Create a Home Valuation Report for This Property
The Home Valuation Report is an in-depth analysis detailing your home's value as well as a comparison with similar homes in the area
Home Values in the Area
Average Home Value in this Area
Purchase History
| Date | Buyer | Sale Price | Title Company |
|---|---|---|---|
| Cross Jeffrey Allen | $135,000 | None Available |
Source: Public Records
Mortgage History
| Date | Status | Borrower | Loan Amount |
|---|---|---|---|
| Open | Cross Jeffrey Allen | $135,600 |
Source: Public Records
Tax History Compared to Growth
Tax History
| Year | Tax Paid | Tax Assessment Tax Assessment Total Assessment is a certain percentage of the fair market value that is determined by local assessors to be the total taxable value of land and additions on the property. | Land | Improvement |
|---|---|---|---|---|
| 2025 | $1,412 | $201,559 | $12,950 | $188,609 |
| 2024 | $1,418 | $201,559 | $12,950 | $188,609 |
| 2023 | $1,418 | $201,559 | $12,950 | $188,609 |
| 2022 | $1,144 | $137,364 | $12,950 | $124,414 |
| 2021 | $1,138 | $137,364 | $12,950 | $124,414 |
| 2020 | $1,134 | $137,364 | $12,950 | $124,414 |
| 2019 | $1,134 | $137,364 | $12,950 | $124,414 |
| 2018 | $1,084 | $130,967 | $12,950 | $118,017 |
| 2017 | $1,082 | $130,967 | $12,950 | $118,017 |
| 2016 | $1,058 | $130,967 | $12,950 | $118,017 |
| 2015 | $1,055 | $130,967 | $12,950 | $118,017 |
| 2014 | $1,053 | $130,967 | $12,950 | $118,017 |
| 2013 | $1,053 | $130,967 | $12,950 | $118,017 |
Source: Public Records
Map
Nearby Homes
- 350 Summers Rd
- 2632 Holly Hills Dr
- 2491 Watts St
- 2912 Woodstream Dr
- 3023 Woodstream Dr
- 3143 2nd St
- 2290 U S 70
- 3119 Peaceful Meadows Dr
- 1438 Bethel Rd
- 632 Drexel Rd
- 3195 Meadow Brook St
- 204 Old Mill Dr
- 2169 E Winds Ave
- 2088 E Winds Ave
- 3471 Greentree Acres Rd
- 3055 Cleet York Rd
- 3151 Morganton Furniture Rd
- 207 Jacksons Run
- 2269 Drexel Heights St
- 3161 Morganton Furniture Rd
- 2703 Farmland Acres
- 2683 Farmland Acres
- 2683 Farmland Acres Unit 15
- 2673 Farmland Acres
- 2694 Farmland Acres
- 2704 Farmland Acres
- 2663 Farmland Acres
- 2723 Farmland Acres
- 2664 Farmland Acres
- 2653 Farmland Acres
- 2650 Farmland Acres
- 2643 Farmland Acres
- 2726 Farmland Acres Rd
- 2636 Farmland Acres
- 2633 Farmland Acres
- 510 Summers Rd
- 668 Summers Rd
- 2779 Moose Lodge St
- 2689 Moose Lodge St
- 586 Summers Rd