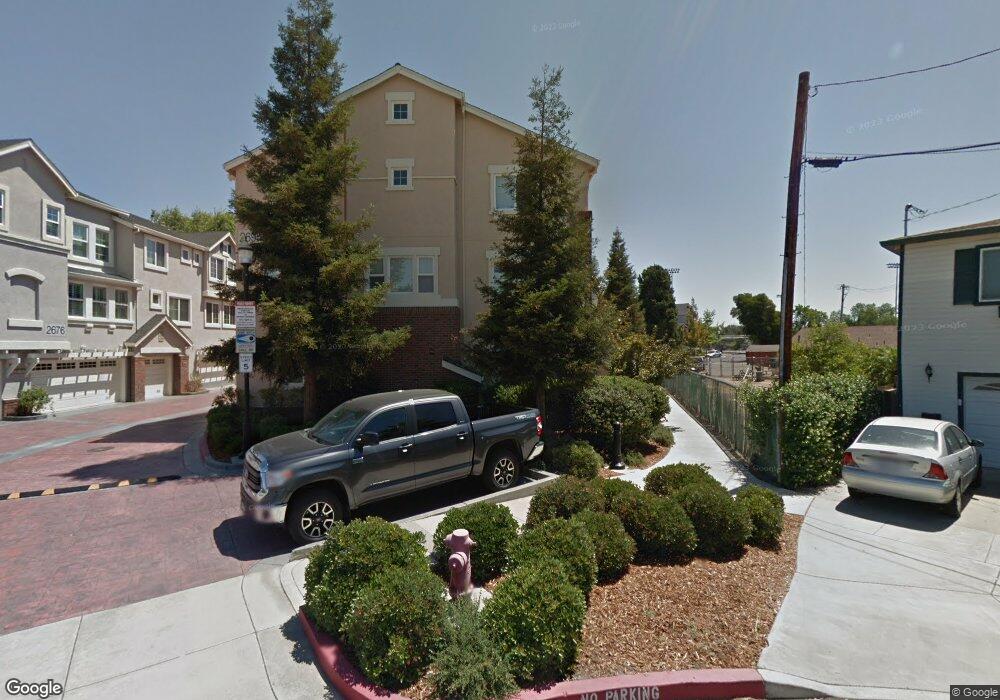
2695 3rd St Unit 1802 Livermore, CA 94550
Downtown Livermore NeighborhoodEstimated Value: $747,443 - $819,000
2
Beds
3
Baths
1,420
Sq Ft
$554/Sq Ft
Est. Value
About This Home
This home is located at 2695 3rd St Unit 1802, Livermore, CA 94550 and is currently estimated at $787,111, approximately $554 per square foot. 2695 3rd St Unit 1802 is a home located in Alameda County with nearby schools including Jackson Avenue Elementary School, East Avenue Middle School, and Livermore High School.
Ownership History
Date
Name
Owned For
Owner Type
Purchase Details
Closed on
Mar 19, 2021
Sold by
Albert Jaber Bypass Trust and Betty H Jaber Revocable Trust
Bought by
Dhesi Bhupinder P
Current Estimated Value
Home Financials for this Owner
Home Financials are based on the most recent Mortgage that was taken out on this home.
Original Mortgage
$553,600
Outstanding Balance
$491,733
Interest Rate
2.7%
Mortgage Type
New Conventional
Estimated Equity
$295,378
Purchase Details
Closed on
Apr 12, 2018
Sold by
Livermore Valley Investments Llc
Bought by
Jaber David
Home Financials for this Owner
Home Financials are based on the most recent Mortgage that was taken out on this home.
Original Mortgage
$220,193
Interest Rate
4.6%
Mortgage Type
Adjustable Rate Mortgage/ARM
Purchase Details
Closed on
Sep 28, 2007
Sold by
Erickson Brenda M
Bought by
Livermore Valley Investments Llc
Purchase Details
Closed on
May 9, 2005
Sold by
Pfeiffer Ranch Investors Inc
Bought by
Erickson Brendan M
Home Financials for this Owner
Home Financials are based on the most recent Mortgage that was taken out on this home.
Original Mortgage
$464,000
Interest Rate
8.1%
Mortgage Type
New Conventional
Create a Home Valuation Report for This Property
The Home Valuation Report is an in-depth analysis detailing your home's value as well as a comparison with similar homes in the area
Home Values in the Area
Average Home Value in this Area
Purchase History
We collect this data history from publicly available records. To have your information removed, we recommend requesting removal directly through your county’s website.
| Date | Buyer | Sale Price | Title Company |
|---|---|---|---|
| Dhesi Bhupinder P | $692,000 | Fidelity National Title | |
| Jaber David | $650,000 | Chicago Title Company | |
| Livermore Valley Investments Llc | $460,000 | Chicago Title Co | |
| Erickson Brendan M | $580,000 | First American Title Co |
Source: Public Records
Mortgage History
We collect this data history from publicly available records. To have your information removed, we recommend requesting removal directly through your county’s website.
| Date | Status | Borrower | Loan Amount |
|---|---|---|---|
| Open | Dhesi Bhupinder P | $553,600 | |
| Previous Owner | Jaber David | $220,193 | |
| Previous Owner | Erickson Brendan M | $464,000 |
Source: Public Records
Tax History
| Year | Tax Paid | Tax Assessment Tax Assessment Total Assessment is a certain percentage of the fair market value that is determined by local assessors to be the total taxable value of land and additions on the property. | Land | Improvement |
|---|---|---|---|---|
| 2025 | $9,386 | $742,034 | $224,710 | $524,324 |
| 2024 | $9,386 | $727,350 | $220,305 | $514,045 |
| 2023 | $9,276 | $719,956 | $215,987 | $503,969 |
| 2022 | $9,138 | $698,840 | $211,752 | $494,088 |
| 2021 | $8,340 | $683,260 | $204,978 | $478,282 |
| 2020 | $8,670 | $676,260 | $202,878 | $473,382 |
| 2019 | $8,715 | $663,000 | $198,900 | $464,100 |
| 2018 | $7,133 | $531,010 | $159,303 | $371,707 |
| 2017 | $6,994 | $520,600 | $156,180 | $364,420 |
| 2016 | $6,669 | $510,392 | $153,117 | $357,275 |
| 2015 | $5,921 | $470,000 | $141,000 | $329,000 |
| 2014 | $5,171 | $400,000 | $120,000 | $280,000 |
Source: Public Records
Map
Nearby Homes
- 2676 3rd St Unit 1701
- 2659 3rd St
- 2797 Patcham Common
- 112 Martin Ave
- 0 Gardella Plaza
- 3610 Madeira Way
- 2235 4th St
- 3370 Gardella Plaza
- 2155 Chestnut St
- 2950 Kelly St
- 607 Morgan Common
- 2746 Kelly St
- 2964 Kennedy St
- 2673 Kennedy St
- 727 S I St
- 161 N L St Unit 103
- 330 Scott St
- 3734 Carrigan Common
- 0 N K St
- 580 S L St
- 2695 3rd St
- 2695 3rd St Unit 1803
- 2695 3rd St Unit 1804
- 2695 3rd St Unit 1801
- 2676 3rd St Unit 1703
- 2676 3rd St Unit 1705
- 2676 3rd St Unit 1704
- 2676 3rd St
- 2676 3rd St Unit 1706
- 2676 3rd St Unit 1702
- 212 Wood St Unit 1606
- 212 Wood St Unit 1605
- 212 Wood St Unit 1603
- 212 Wood St Unit 1602
- 212 Wood St Unit 1601
- 212 Wood St Unit 1604
- 220 Wood St
- 220 Wood St Unit 604
- 220 Wood St Unit 603
- 220 Wood St Unit 602
Your Personal Tour Guide
Ask me questions while you tour the home.