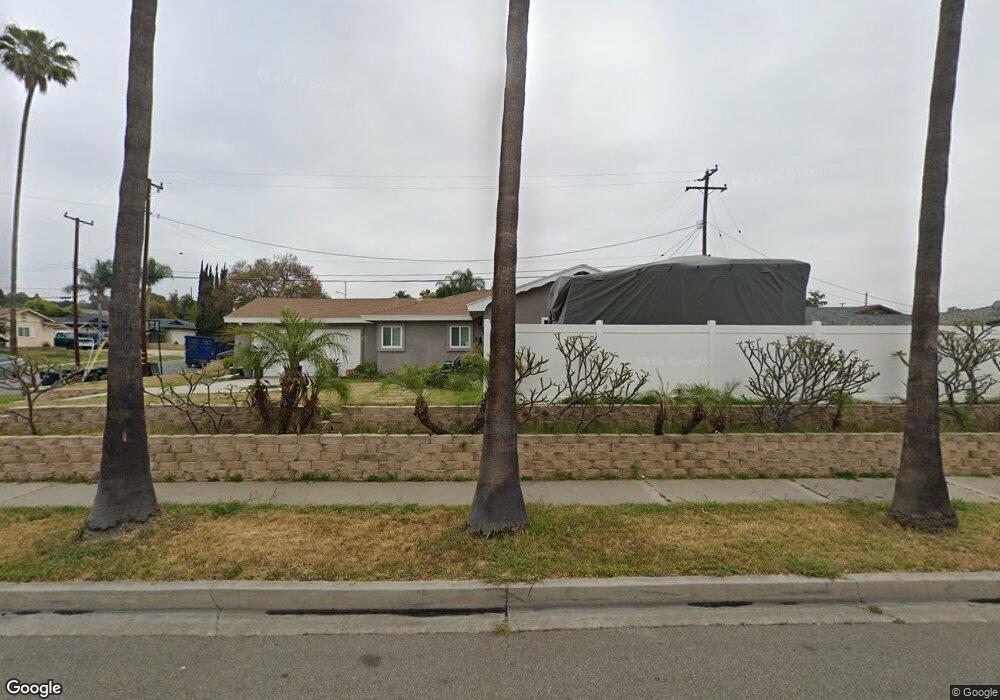
2695 N Gaff St Orange, CA 92865
Estimated Value: $937,000 - $1,053,000
3
Beds
2
Baths
1,213
Sq Ft
$808/Sq Ft
Est. Value
About This Home
This home is located at 2695 N Gaff St, Orange, CA 92865 and is currently estimated at $980,683, approximately $808 per square foot. 2695 N Gaff St is a home located in Orange County with nearby schools including Olive Elementary School, Cerro Villa Middle School, and Villa Park High School.
Ownership History
Date
Name
Owned For
Owner Type
Purchase Details
Closed on
Oct 28, 2009
Sold by
Doss Pamela
Bought by
Doss Pamela and The Doss Trust
Current Estimated Value
Home Financials for this Owner
Home Financials are based on the most recent Mortgage that was taken out on this home.
Original Mortgage
$194,500
Outstanding Balance
$127,001
Interest Rate
5%
Mortgage Type
New Conventional
Estimated Equity
$853,682
Purchase Details
Closed on
Aug 5, 2005
Sold by
Doss Pamela
Bought by
Doss Pamela and Doss Trust
Purchase Details
Closed on
Jul 10, 2001
Sold by
Marlow Wade F and Marlow Grace E
Bought by
Doss Pamela
Home Financials for this Owner
Home Financials are based on the most recent Mortgage that was taken out on this home.
Original Mortgage
$135,000
Interest Rate
7.1%
Create a Home Valuation Report for This Property
The Home Valuation Report is an in-depth analysis detailing your home's value as well as a comparison with similar homes in the area
Home Values in the Area
Average Home Value in this Area
Purchase History
| Date | Buyer | Sale Price | Title Company |
|---|---|---|---|
| Doss Pamela | -- | Accommodation | |
| Doss Pamela | -- | First American Title Company | |
| Doss Pamela | -- | -- | |
| Doss Pamela | $253,000 | -- |
Source: Public Records
Mortgage History
| Date | Status | Borrower | Loan Amount |
|---|---|---|---|
| Open | Doss Pamela | $194,500 | |
| Closed | Doss Pamela | $135,000 |
Source: Public Records
Tax History
| Year | Tax Paid | Tax Assessment Tax Assessment Total Assessment is a certain percentage of the fair market value that is determined by local assessors to be the total taxable value of land and additions on the property. | Land | Improvement |
|---|---|---|---|---|
| 2025 | $4,266 | $373,744 | $298,234 | $75,510 |
| 2024 | $4,266 | $366,416 | $292,386 | $74,030 |
| 2023 | $4,170 | $359,232 | $286,653 | $72,579 |
| 2022 | $4,088 | $352,189 | $281,033 | $71,156 |
| 2021 | $3,976 | $345,284 | $275,523 | $69,761 |
| 2020 | $3,940 | $341,744 | $272,698 | $69,046 |
| 2019 | $3,892 | $335,044 | $267,351 | $67,693 |
| 2018 | $3,833 | $328,475 | $262,109 | $66,366 |
| 2017 | $3,678 | $322,035 | $256,970 | $65,065 |
| 2016 | $3,609 | $315,721 | $251,931 | $63,790 |
| 2015 | $3,556 | $310,979 | $248,147 | $62,832 |
| 2014 | $3,480 | $304,888 | $243,286 | $61,602 |
Source: Public Records
Map
Nearby Homes
- 1248 E Saint James Ave
- 1403 E Sail Ave
- 1226 E Ensign Cir
- 2620 N Dunbar St
- 16732 E Main St
- 2433 N Cameo Ct
- 3036 N Skywood St
- 1800 E Heim Ave Unit 48
- 1800 E Heim Ave Unit 29
- 2496 N Beechwood St
- 1119 E Cumberland Rd
- 1308 E Sunview Dr
- 3176 N Tustin St
- 2850 N Glassell St
- 2078 E Nohl Ranch Rd
- 130 W Crystal View Ave
- 2295 N Tustin St Unit 31
- 208 W Cork Tree Dr
- 2244 E Pepper Hill Dr
- 231 W Cork Tree Dr
- 1122 E Sail Ave
- 2683 N Gaff St
- 1121 E Buoy Ave
- 1132 E Sail Ave
- 2702 N Gaff St
- 1111 E Sail Ave
- 2692 N Gaff St
- 1131 E Buoy Ave
- 2710 N Gaff St
- 1039 E Buoy Ave
- 1125 E Sail Ave
- 1146 E Sail Ave
- 2729 N Gaff St
- 2720 N Gaff St
- 1145 E Buoy Ave
- 1135 E Sail Ave
- 2701 N Galley St
- 2689 N Galley St
- 2709 N Galley St
- 1110 E Buoy Ave
Your Personal Tour Guide
Ask me questions while you tour the home.