Estimated payment $4,808/month
Highlights
- Above Ground Pool
- Deck
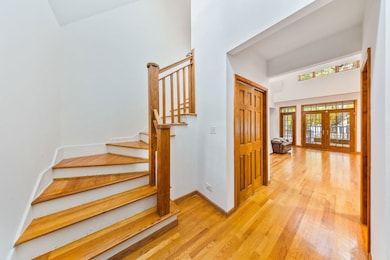
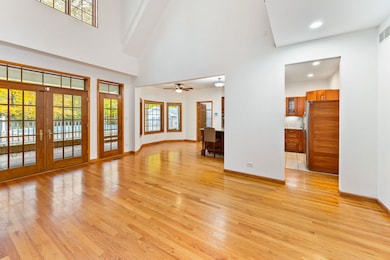
- Wood Flooring
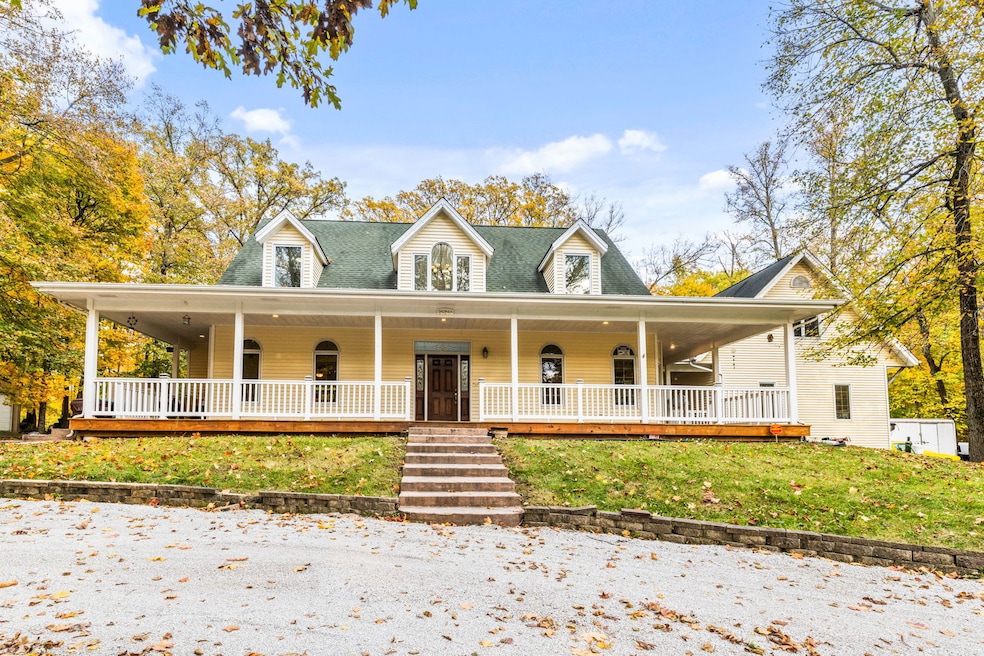
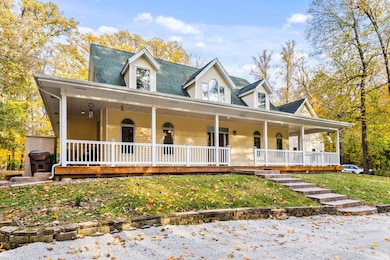
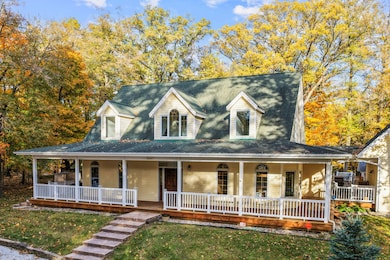
- Cape Cod Architecture
- Wooded Lot
- Main Floor Bedroom
About This Home
Come see this newly listed, beautiful Cape Cod style home that you will find interesting. This charming residence offers three comfortable bedrooms, with the primary bedroom conveniently located on the first floor for easy access. A full 9' basement has 2 access points from the house and outside. There's a full bathroom completely roughed-in ready to be finished. Additional features of this home is an elegant wrap-around porch, perfect for relaxing, and a practical eat-in kitchen. The property is situated on a spacious two-acre lot and includes several desirable amenities and a 28' above ground pool. There is a 2-1/2 car garage, connected to the main house by a breezeway, with a second floor bonus room, offering great opportunities as a man cave or office and storage. So much to see at this remarkable property.
Home Details
Home Type
- Single Family
Est. Annual Taxes
- $10,177
Year Built
- Built in 2004
Lot Details
- Wooded Lot
Parking
- 4 Car Garage
- Parking Included in Price
Home Design
- Cape Cod Architecture
- Asphalt Roof
- Concrete Perimeter Foundation
Interior Spaces
- 2,600 Sq Ft Home
- 2-Story Property
- Ceiling Fan
- Family Room
- Living Room
- Formal Dining Room
- Wood Flooring
- Basement
- Sump Pump
- Home Security System
- Laundry Room
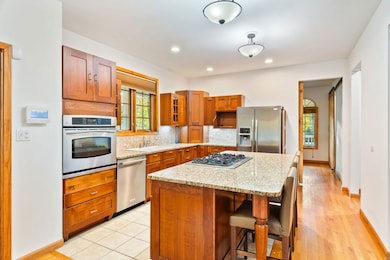
Kitchen
- Cooktop
- Microwave
- Dishwasher
Bedrooms and Bathrooms
- 3 Bedrooms
- 3 Potential Bedrooms
- Main Floor Bedroom
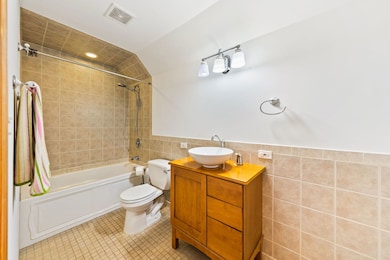
- Bathroom on Main Level
- Soaking Tub
- Separate Shower
Outdoor Features
- Above Ground Pool
- Deck
- Porch
Schools
- Monee Elementary School
- Crete-Monee Middle School
- Crete-Monee High School
Utilities
- Central Air
- Vented Exhaust Fan
- Heating System Uses Natural Gas
- 200+ Amp Service
- Well
- Water Softener is Owned
- Septic Tank
- Cable TV Available
Community Details
- Racoon Grove Subdivision
Listing and Financial Details
- Homeowner Tax Exemptions
Map
Home Values in the Area
Average Home Value in this Area
Tax History
| Year | Tax Paid | Tax Assessment Tax Assessment Total Assessment is a certain percentage of the fair market value that is determined by local assessors to be the total taxable value of land and additions on the property. | Land | Improvement |
|---|---|---|---|---|
| 2024 | $10,177 | $121,270 | $26,078 | $95,192 |
| 2023 | $10,177 | $104,543 | $22,481 | $82,062 |
| 2022 | $8,642 | $91,963 | $19,776 | $72,187 |
| 2021 | $8,133 | $83,807 | $18,165 | $65,642 |
| 2020 | $8,103 | $81,090 | $17,576 | $63,514 |
| 2019 | $7,863 | $76,899 | $16,668 | $60,231 |
| 2018 | $7,640 | $74,039 | $16,284 | $57,755 |
| 2017 | $7,393 | $70,221 | $15,778 | $54,443 |
| 2016 | $7,380 | $69,601 | $15,194 | $54,407 |
| 2015 | $6,829 | $64,832 | $14,138 | $50,694 |
| 2014 | $6,829 | $63,937 | $13,943 | $49,994 |
| 2013 | $6,829 | $66,950 | $14,600 | $52,350 |
Property History
| Date | Event | Price | List to Sale | Price per Sq Ft |
|---|---|---|---|---|
| 11/14/2025 11/14/25 | For Sale | $749,900 | -- | $288 / Sq Ft |
Purchase History
| Date | Type | Sale Price | Title Company |
|---|---|---|---|
| Quit Claim Deed | -- | None Listed On Document | |
| Interfamily Deed Transfer | -- | None Available | |
| Interfamily Deed Transfer | -- | None Available | |
| Interfamily Deed Transfer | -- | None Available | |
| Warranty Deed | $30,000 | Chicago Title Insurance Co |
Mortgage History
| Date | Status | Loan Amount | Loan Type |
|---|---|---|---|
| Previous Owner | $177,300 | New Conventional |
Source: Midwest Real Estate Data (MRED)
MLS Number: 12514546
APN: 21-14-28-300-081
Disclaimer: Certain information contained herein is derived from information provided by parties other than Homes.com. All information provided is deemed reliable, but is not guaranteed to be accurate and should be independently verified.
![]() Based on information submitted to the MLS GRID. All data is obtained from various sources and may not have been verified by broker or MLS GRID. Supplied Open House Information is subject to change without notice. All information should be independently reviewed and verified for accuracy. Properties may or may not be listed by the office/agent presenting the information. Some IDX listings have been excluded from this website.
Based on information submitted to the MLS GRID. All data is obtained from various sources and may not have been verified by broker or MLS GRID. Supplied Open House Information is subject to change without notice. All information should be independently reviewed and verified for accuracy. Properties may or may not be listed by the office/agent presenting the information. Some IDX listings have been excluded from this website.
The Digital Millennium Copyright Act of 1998, 17 U.S.C. § 512 (the “DMCA”) provides recourse for copyright owners who believe that material appearing on the Internet infringes their rights under U.S. copyright law. If you believe in good faith that any content or material made available in connection with our website or services infringes your copyright, you (or your agent) may send us a notice requesting that the content or material be removed, or access to it blocked.
Notices must be sent in writing by email to DMCAnotice@MLSGrid.com.
The DMCA requires that your notice of alleged copyright infringement include the following information:
(1) description of the copyrighted work that is the subject of claimed infringement;
(2) description of the alleged infringing content and information sufficient to permit us to locate the content;
(3) contact information for you, including your address, telephone number and email address;
(4) a statement by you that you have a good faith belief that the content in the manner complained of is not authorized by the copyright owner, or its agent, or by the operation of any law;
(5) a statement by you, signed under penalty of perjury, that the information in the notification is accurate and that you have the authority to enforce the copyrights that are claimed to be infringed; and
(6) a physical or electronic signature of the copyright owner or a person authorized to act on the copyright owner’s behalf. Failure to include all of the above information may result in the delay of the processing of your complaint.
- 26852 S Meghan Ct S
- 26915 S Egyptian Trail
- 5456 W Heatherbrook Trail
- 5147 W Jason Dr
- 5548 W Heatherbrook Trail
- 4300 W Pauling Rd
- 26760 S Fox Wood Dr
- 5531 W Hilltop Rd
- 26616 S Egyptian Trail
- 4816 W Roberts Ridge Rd
- 5320 W Orchard Trail
- 26253 S Ruby St Unit 1
- 5221 W Mulberry Ln
- 26205 S Ruby St
- 5406 W Mulberry Ln
- 5332 W Mulberry Ln
- 26165 S County Fair Dr
- 4999 W Hawk Ln
- 26103 S Ruby St Unit 1
- 4996 W Ribbon Dr
- 26248 Apple Blossom Ln
- 26229 S Peach Tree Ln
- 5154 W Park Ln
- 5543 W Margaret St Unit B
- 5100 Augusta Blvd Unit 134
- 25773 S Hoover Ct
- 25766 S Taft St
- 29837 Illinois 50 Unit 41A
- 29837 Illinois 50 Unit 39A
- 660 Sullivan Ln
- 818 Sandra Dr Unit 818 Sandra Dr
- 906 Blackhawk Dr
- 701 Sandra Dr
- 19 Sandpiper Ln Unit 19SAND
- 8 Drake Ln Unit 8DRAK
- 759 Burr Oak Ln
- 17 Meadowlark Ln Unit 17MEAD
- 73 Meadowlark Ln Unit 73MEAD
- 43 Partridge Ln Unit 43PART
- 235 Tampa St
