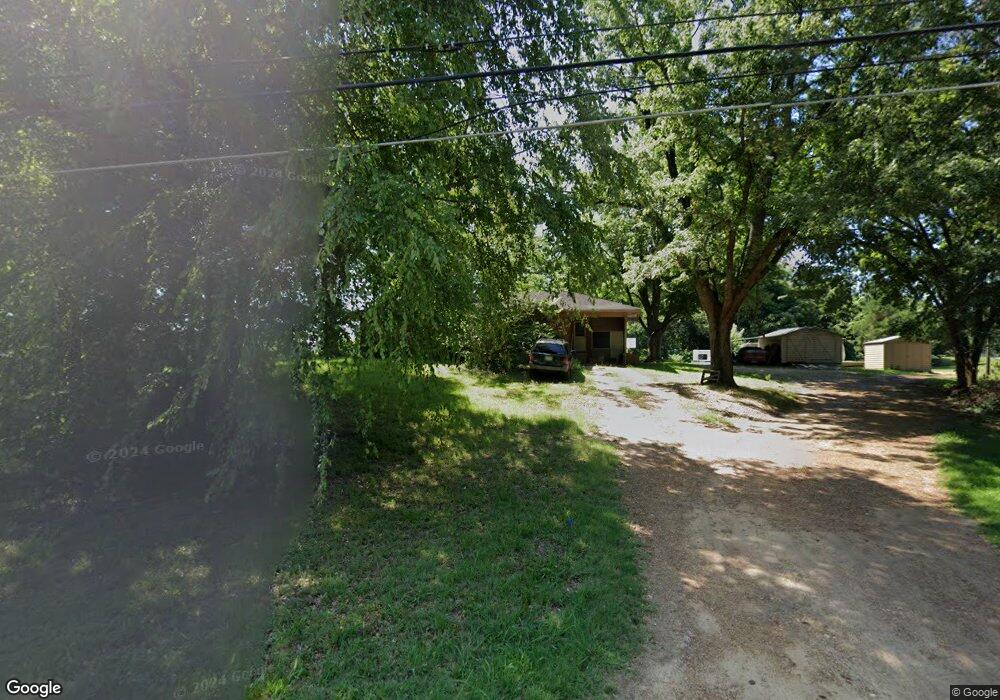
2698 Quito Drummonds Rd Drummonds, TN 38023
Estimated Value: $194,000 - $240,000
--
Bed
1
Bath
1,371
Sq Ft
$153/Sq Ft
Est. Value
About This Home
This home is located at 2698 Quito Drummonds Rd, Drummonds, TN 38023 and is currently estimated at $209,220, approximately $152 per square foot. 2698 Quito Drummonds Rd is a home located in Tipton County with nearby schools including Drummonds Elementary School, Munford Middle School, and Munford High School.
Ownership History
Date
Name
Owned For
Owner Type
Purchase Details
Closed on
May 3, 2005
Sold by
Travis Josh J
Bought by
Richard Jerry
Current Estimated Value
Home Financials for this Owner
Home Financials are based on the most recent Mortgage that was taken out on this home.
Original Mortgage
$76,794
Outstanding Balance
$40,144
Interest Rate
5.88%
Estimated Equity
$169,076
Purchase Details
Closed on
Feb 4, 2005
Sold by
Travis Josh J
Bought by
Baize David O
Purchase Details
Closed on
Aug 23, 1999
Sold by
Baize David O
Bought by
Travis Josh J
Purchase Details
Closed on
Aug 20, 1993
Bought by
Baize David O and Debra Kay
Purchase Details
Closed on
Jan 10, 1993
Purchase Details
Closed on
Nov 19, 1987
Bought by
King King A and King Louise
Purchase Details
Closed on
Aug 27, 1960
Bought by
King Ah
Create a Home Valuation Report for This Property
The Home Valuation Report is an in-depth analysis detailing your home's value as well as a comparison with similar homes in the area
Home Values in the Area
Average Home Value in this Area
Purchase History
| Date | Buyer | Sale Price | Title Company |
|---|---|---|---|
| Richard Jerry | $78,000 | -- | |
| Baize David O | -- | -- | |
| Travis Josh J | -- | -- | |
| Travis Josh J | $60,000 | -- | |
| Baize David O | $52,000 | -- | |
| -- | -- | -- | |
| King King A | -- | -- | |
| King Ah | -- | -- |
Source: Public Records
Mortgage History
| Date | Status | Borrower | Loan Amount |
|---|---|---|---|
| Open | King Ah | $76,794 |
Source: Public Records
Tax History Compared to Growth
Tax History
| Year | Tax Paid | Tax Assessment Tax Assessment Total Assessment is a certain percentage of the fair market value that is determined by local assessors to be the total taxable value of land and additions on the property. | Land | Improvement |
|---|---|---|---|---|
| 2024 | $687 | $45,150 | $5,950 | $39,200 |
| 2023 | $687 | $45,150 | $5,950 | $39,200 |
| 2022 | $654 | $32,075 | $4,375 | $27,700 |
| 2021 | $654 | $32,075 | $4,375 | $27,700 |
| 2020 | $654 | $32,075 | $4,375 | $27,700 |
| 2019 | $493 | $20,375 | $3,875 | $16,500 |
| 2018 | $493 | $20,375 | $3,875 | $16,500 |
| 2017 | $493 | $20,375 | $3,875 | $16,500 |
| 2016 | $493 | $20,375 | $3,875 | $16,500 |
| 2015 | $492 | $20,375 | $3,875 | $16,500 |
| 2014 | $492 | $20,373 | $0 | $0 |
Source: Public Records
Map
Nearby Homes
- 0 Dixon Rd
- 0 Ray Bluff Rd
- 5391 Simmons Rd
- 30 Kight Rd
- 979 Ray Bluff Rd
- 400 Whippoorwill Cir
- 1461 Armstrong Rd
- 97 Richardson Lake Dr
- 119 Nancy Dr
- 243 Morgan Way
- 05 Richardson Landing Rd
- 0 Richardson Landing Rd Unit 10207422
- 0 Richardson Landing Rd Unit LotWP000 16969392
- 0 Richardson Landing Rd Unit 10161338
- 9640 New Bethel Rd
- 52 Wilkinsville Rd
- 1296 Monasco Rd
- 59 Pryor Rd
- 2664 Glen Springs Rd
- 4366 Campground Rd
- 2668 Quito Drummonds Rd
- 2749 Quito Drummonds Rd
- 2726 Quito Drummonds Rd
- 2816 Quito Drummonds Rd
- 2557 Quito Drummonds Rd
- 2554 Quito Drummonds Rd
- 2881 Quito Drummonds Rd
- 2730 Quito Drummonds Rd
- 2538 Quito Drummonds Rd
- 0 Quito-Drummonds Rd
- 3159 Quito Drummonds Rd
- 428 Bluff Rd
- 3226 Quito Drummonds Rd
- 3254 Quito Drummonds Rd
- 3255 Quito Drummonds Rd
- 464 Bluff Rd
- 3276 Quito Drummonds Rd
- 5671 Simmons Rd
- 3292 Drummonds Rd
- 170 Dixon Rd