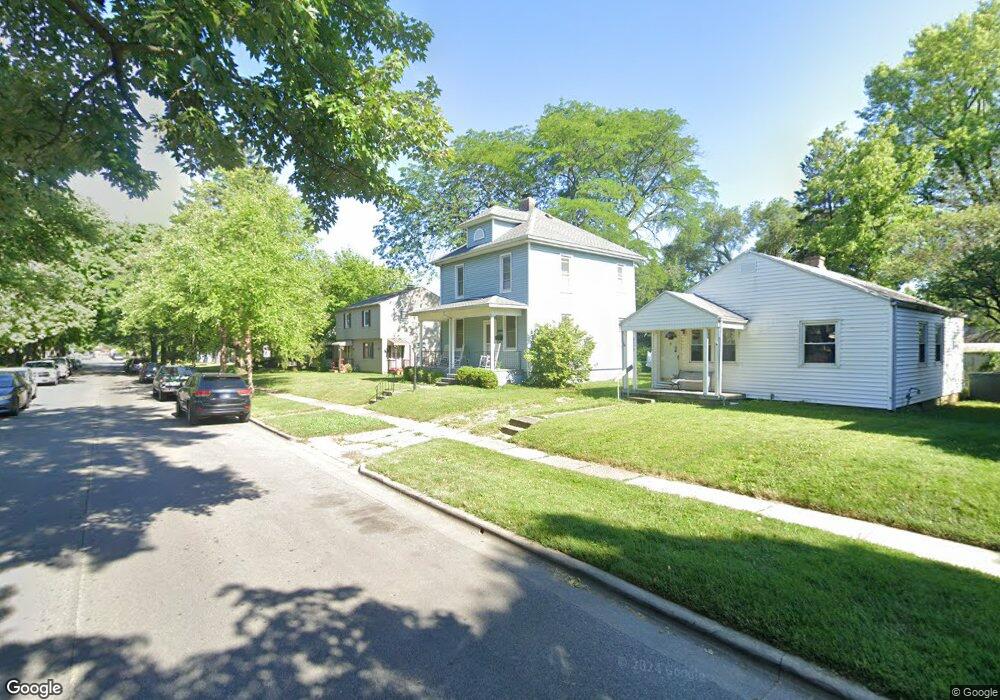
2699 Allegheny Ave Columbus, OH 43209
Estimated Value: $240,000 - $324,000
2
Beds
1
Bath
1,152
Sq Ft
$245/Sq Ft
Est. Value
About This Home
This home is located at 2699 Allegheny Ave, Columbus, OH 43209 and is currently estimated at $281,921, approximately $244 per square foot. 2699 Allegheny Ave is a home located in Franklin County with nearby schools including Maryland Elementary School, Bexley Middle School, and Bexley High School.
Ownership History
Date
Name
Owned For
Owner Type
Purchase Details
Closed on
Jun 1, 2009
Sold by
Prunte Beth Ann and Prunte Dominic W
Bought by
Gruber Mary Kathleen
Current Estimated Value
Home Financials for this Owner
Home Financials are based on the most recent Mortgage that was taken out on this home.
Original Mortgage
$75,000
Outstanding Balance
$47,539
Interest Rate
4.83%
Mortgage Type
Purchase Money Mortgage
Estimated Equity
$234,382
Purchase Details
Closed on
May 26, 2009
Sold by
Estate Of Josephine A Simon
Bought by
Prunte Beth Ann
Home Financials for this Owner
Home Financials are based on the most recent Mortgage that was taken out on this home.
Original Mortgage
$75,000
Outstanding Balance
$47,539
Interest Rate
4.83%
Mortgage Type
Purchase Money Mortgage
Estimated Equity
$234,382
Purchase Details
Closed on
May 3, 1967
Bought by
Simon Josephine A
Create a Home Valuation Report for This Property
The Home Valuation Report is an in-depth analysis detailing your home's value as well as a comparison with similar homes in the area
Home Values in the Area
Average Home Value in this Area
Purchase History
| Date | Buyer | Sale Price | Title Company |
|---|---|---|---|
| Gruber Mary Kathleen | $75,000 | Chicago Tit | |
| Prunte Beth Ann | -- | Independent | |
| Simon Josephine A | -- | -- |
Source: Public Records
Mortgage History
| Date | Status | Borrower | Loan Amount |
|---|---|---|---|
| Open | Gruber Mary Kathleen | $75,000 |
Source: Public Records
Tax History Compared to Growth
Tax History
| Year | Tax Paid | Tax Assessment Tax Assessment Total Assessment is a certain percentage of the fair market value that is determined by local assessors to be the total taxable value of land and additions on the property. | Land | Improvement |
|---|---|---|---|---|
| 2024 | $4,741 | $83,760 | $27,830 | $55,930 |
| 2023 | $4,272 | $83,760 | $27,830 | $55,930 |
| 2022 | $2,618 | $41,230 | $17,010 | $24,220 |
| 2021 | $2,620 | $41,230 | $17,010 | $24,220 |
| 2020 | $2,597 | $41,230 | $17,010 | $24,220 |
| 2019 | $2,472 | $34,520 | $14,180 | $20,340 |
| 2018 | $1,964 | $34,520 | $14,180 | $20,340 |
| 2017 | $1,937 | $34,520 | $14,180 | $20,340 |
| 2016 | $1,821 | $28,000 | $9,940 | $18,060 |
| 2015 | $1,827 | $28,000 | $9,940 | $18,060 |
| 2014 | $1,837 | $28,000 | $9,940 | $18,060 |
| 2013 | $955 | $28,000 | $9,940 | $18,060 |
Source: Public Records
Map
Nearby Homes
- 2779 Columbus Ave
- 696 Northview Ave
- 2742 E 5th Ave
- 2822-2824 E 5th Ave
- 782 Northview Ave
- 796 Northview Ave
- 354 N Roosevelt Ave Unit 356
- 799 Alton Ave
- 170 N Cassingham Rd
- 3018 E 6th Ave Unit 20
- 0 E 7th Ave Unit Lot 79 225013171
- 0 E 7th Ave Unit Lot 77 225013170
- 0 E 7th Ave Unit Lot 78 225013168
- 2814 E 9th Ave
- 00 E 7th Ave
- 2857 E 10th Ave
- 205 N Gould Rd
- 3059 E 8th Ave
- 3105 E 6th Ave
- 3116 E 5th Ave
- 2693 Allegheny Ave
- 2707 Allegheny Ave Unit 709
- 2707 Allegheny Ave Unit 2709
- 2683 Allegheny Ave
- 2681 Allegheny Ave
- 2715 Allegheny Ave
- 2692 Bellwood Ave
- 2688 Bellwood Ave
- 2702 Bellwood Ave
- 2679 Allegheny Ave
- 2719 Allegheny Ave
- 2704 Bellwood Ave
- 2682 Bellwood Ave
- 2702 Allegheny Ave Unit 704
- 2696-2698 Allegheny Ave
- 2706 Allegheny Ave Unit 708
- 2696 Allegheny Ave Unit 698
- 2696 Allegheny Ave Unit 98
- 2696 Allegheny Ave Unit 2698 & 2696
- 2706 Bellwood Ave