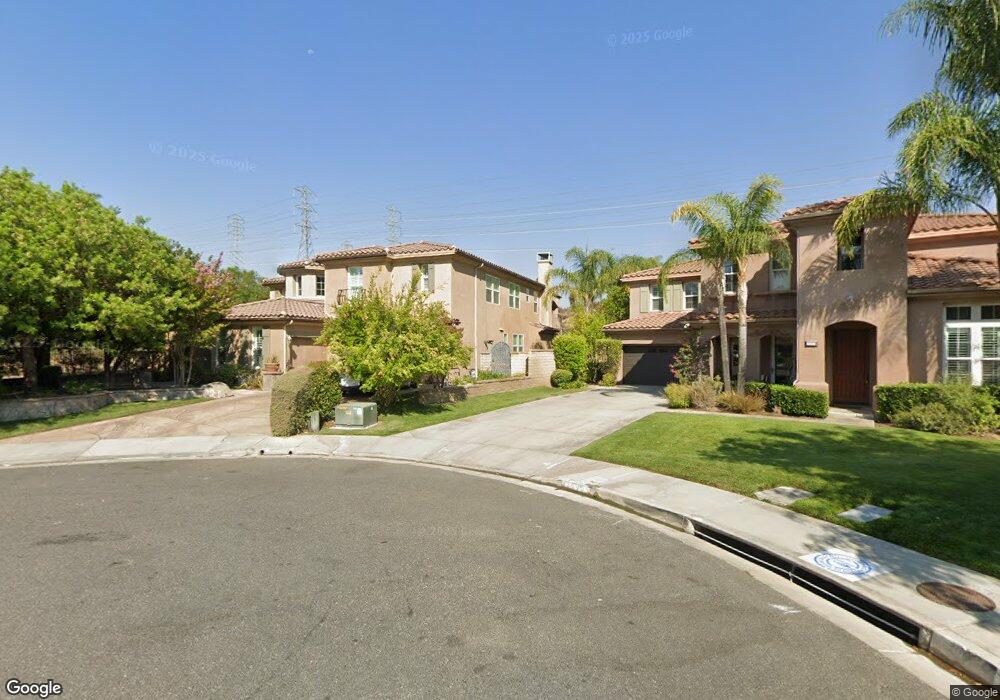
26995 Pebble Ridge Place Valencia, CA 91381
Estimated Value: $1,729,000 - $2,077,000
8
Beds
7
Baths
5,225
Sq Ft
$370/Sq Ft
Est. Value
About This Home
This home is located at 26995 Pebble Ridge Place, Valencia, CA 91381 and is currently estimated at $1,933,286, approximately $370 per square foot. 26995 Pebble Ridge Place is a home located in Los Angeles County with nearby schools including Oak Hills Elementary School, Rancho Pico Junior High School, and West Ranch High School.
Ownership History
Date
Name
Owned For
Owner Type
Purchase Details
Closed on
Apr 3, 2025
Sold by
Cassio Stanley
Bought by
Cassio Family Trust and Cassio
Current Estimated Value
Purchase Details
Closed on
Nov 22, 2017
Sold by
Cassio Sue
Bought by
Cassio Stanley
Home Financials for this Owner
Home Financials are based on the most recent Mortgage that was taken out on this home.
Original Mortgage
$636,000
Interest Rate
3.94%
Mortgage Type
New Conventional
Purchase Details
Closed on
Sep 8, 2003
Sold by
Greystone Homes Inc
Bought by
Cassio Stanley and Cassio Sue
Home Financials for this Owner
Home Financials are based on the most recent Mortgage that was taken out on this home.
Original Mortgage
$684,609
Interest Rate
6%
Mortgage Type
Purchase Money Mortgage
Create a Home Valuation Report for This Property
The Home Valuation Report is an in-depth analysis detailing your home's value as well as a comparison with similar homes in the area
Home Values in the Area
Average Home Value in this Area
Purchase History
| Date | Buyer | Sale Price | Title Company |
|---|---|---|---|
| Cassio Family Trust | -- | None Listed On Document | |
| Cassio Stanley | -- | First American Title Company | |
| Cassio Stanley | $856,000 | North American Title Co |
Source: Public Records
Mortgage History
| Date | Status | Borrower | Loan Amount |
|---|---|---|---|
| Previous Owner | Cassio Stanley | $636,000 | |
| Previous Owner | Cassio Stanley | $684,609 |
Source: Public Records
Tax History Compared to Growth
Tax History
| Year | Tax Paid | Tax Assessment Tax Assessment Total Assessment is a certain percentage of the fair market value that is determined by local assessors to be the total taxable value of land and additions on the property. | Land | Improvement |
|---|---|---|---|---|
| 2025 | $18,819 | $1,445,035 | $487,381 | $957,654 |
| 2024 | $18,819 | $1,416,702 | $477,825 | $938,877 |
| 2023 | $18,307 | $1,388,924 | $468,456 | $920,468 |
| 2022 | $18,042 | $1,361,691 | $459,271 | $902,420 |
| 2021 | $17,742 | $1,334,992 | $450,266 | $884,726 |
| 2019 | $17,393 | $1,295,398 | $436,912 | $858,486 |
| 2018 | $16,797 | $1,269,999 | $428,346 | $841,653 |
| 2017 | $16,367 | $1,245,098 | $419,948 | $825,150 |
| 2016 | $15,787 | $1,220,685 | $411,714 | $808,971 |
| 2015 | $15,777 | $1,202,350 | $405,530 | $796,820 |
| 2014 | $15,361 | $1,178,799 | $397,587 | $781,212 |
Source: Public Records
Map
Nearby Homes
- 25679 Smoketree Ln
- 26958 Timberline Terrace
- 26161 Quartz Mesa Ln
- 26821 Peppertree Dr
- 26802 Stonegate Dr
- 26858 Pine Hollow Ct
- 26812 Peppertree Dr
- 27017 Fairway Ln Unit 73
- 27035 Fairway Ln Unit 66
- 26640 Via Bellazza
- 27012 Fairway Ln Unit 87
- 26767 Via la Paz
- 27273 Baviera Way
- 26720 Afton Ln
- 27228 Diamond Peak Ln Unit 301
- 27209 Cranmore Way Unit 203
- 26747 Laurel Mountain Loop
- 26849 Laurel Mountain Loop
- Opal 2 Plan at Valencia - Opal North
- Opal 4 Plan at Valencia - Opal North
- 26999 Pebble Ridge Place
- 26994 Pebble Ridge Place
- 26990 Pebble Ridge Place
- 26962 Boulder Crest Dr
- 26982 Pebble Ridge Place
- 26954 Boulder Crest Dr
- 26968 Boulder Crest Dr
- 26974 Pebble Ridge Place
- 26946 Boulder Crest Dr
- 26961 Boulder Crest Dr
- 26966 Pebble Ridge Place
- 26938 Boulder Crest Dr
- 26953 Boulder Crest Dr
- 26947 Boulder Crest Dr
- 26958 Pebble Ridge Place
- 26939 Boulder Crest Dr
- 26952 Pebble Ridge Place
- 26933 Boulder Crest Dr
- 26924 Boulder Crest Dr