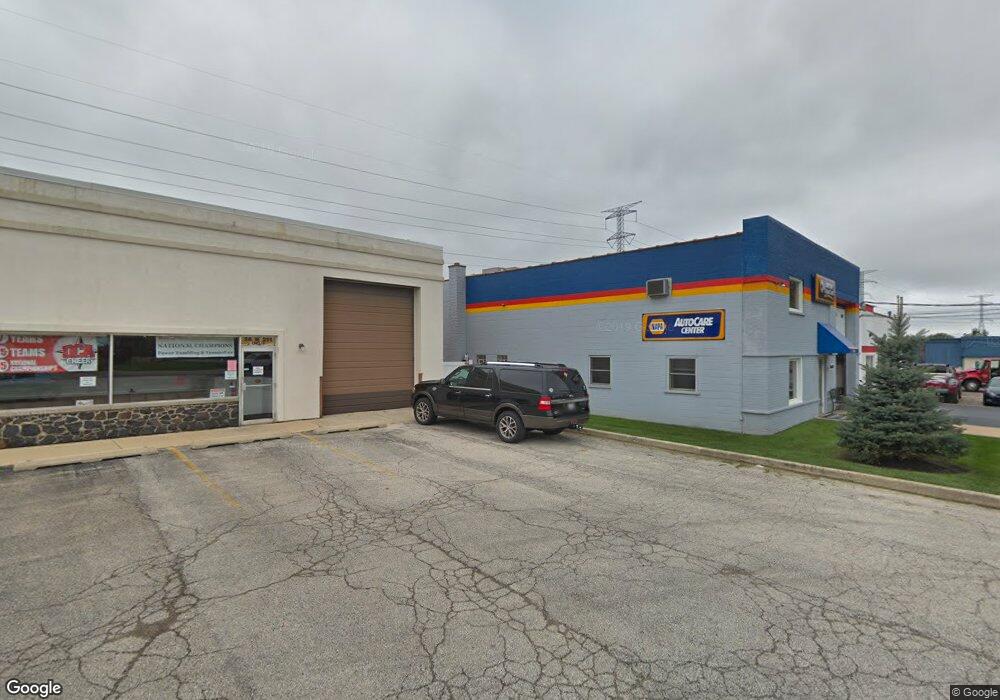
26W285 Saint Charles Rd Carol Stream, IL 60188
Estimated Value: $757,933
--
Bed
--
Bath
4,080
Sq Ft
$186/Sq Ft
Est. Value
About This Home
This home is located at 26W285 Saint Charles Rd, Carol Stream, IL 60188 and is currently estimated at $757,933, approximately $185 per square foot. 26W285 Saint Charles Rd is a home located in DuPage County with nearby schools including Field Kindergarten Center, Carol Stream Elementary School, and Jay Stream Middle School.
Ownership History
Date
Name
Owned For
Owner Type
Purchase Details
Closed on
Apr 27, 2023
Sold by
Robert J Selga Trust
Bought by
Tjnda Corp
Current Estimated Value
Purchase Details
Closed on
Mar 8, 2017
Sold by
Selga Robert J
Bought by
Selga Robert J and The Robert J Selga Trust All I
Purchase Details
Closed on
Jun 3, 2002
Sold by
Hausten Lisa Anne and David Roy Hausten Trust
Bought by
Selga Robert J and Selga Debra A
Home Financials for this Owner
Home Financials are based on the most recent Mortgage that was taken out on this home.
Original Mortgage
$321,000
Interest Rate
6.87%
Mortgage Type
Commercial
Purchase Details
Closed on
May 1, 2001
Sold by
Hausten David R and Hausten David Roy
Bought by
Hausten Lisa Anne and David Roy Hausten Trust
Create a Home Valuation Report for This Property
The Home Valuation Report is an in-depth analysis detailing your home's value as well as a comparison with similar homes in the area
Home Values in the Area
Average Home Value in this Area
Purchase History
| Date | Buyer | Sale Price | Title Company |
|---|---|---|---|
| Tjnda Corp | $650,000 | None Listed On Document | |
| Selga Robert J | -- | Attorney | |
| Selga Robert J | $401,000 | Premier Title | |
| Hausten Lisa Anne | -- | -- |
Source: Public Records
Mortgage History
| Date | Status | Borrower | Loan Amount |
|---|---|---|---|
| Previous Owner | Selga Robert J | $321,000 |
Source: Public Records
Tax History Compared to Growth
Tax History
| Year | Tax Paid | Tax Assessment Tax Assessment Total Assessment is a certain percentage of the fair market value that is determined by local assessors to be the total taxable value of land and additions on the property. | Land | Improvement |
|---|---|---|---|---|
| 2024 | $13,015 | $159,072 | $52,740 | $106,332 |
| 2023 | $12,357 | $145,470 | $48,230 | $97,240 |
| 2022 | $10,440 | $119,340 | $39,710 | $79,630 |
| 2021 | $9,972 | $113,390 | $37,730 | $75,660 |
| 2020 | $9,816 | $110,620 | $36,810 | $73,810 |
| 2019 | $9,460 | $106,300 | $35,370 | $70,930 |
| 2018 | $6,465 | $71,470 | $23,610 | $47,860 |
| 2017 | $6,155 | $66,240 | $21,880 | $44,360 |
| 2016 | $5,861 | $61,300 | $20,250 | $41,050 |
| 2015 | $5,760 | $57,210 | $18,900 | $38,310 |
| 2014 | $5,859 | $57,210 | $18,900 | $38,310 |
| 2013 | $5,870 | $59,170 | $19,550 | $39,620 |
Source: Public Records
Map
Nearby Homes
- 27W130 W Street Charles Rd
- Lot 2 W Street Charles Rd
- 26W199 Klein Creek Dr
- 1N539 Turnberry Ln
- 426 Thunderbird Trail
- 27W046 North Ave
- 352 Sioux Ln
- 299 Bennett Dr
- 26W080 Wood Lark Dr
- 403 Arrowhead Trail
- 342 Seminole Ln
- 552 Cochise Place
- 269 Thunderbird Trail
- 229 Shawnee Dr
- 1N307 Richard Ave
- 1N274 Woods Ave
- 206 Yuma Ln
- 1N100 Harriet St
- 332 El Paso Ln
- 1430 Preserve Dr Unit 29
- 26W287 Saint Charles Rd
- 26W258 Saint Charles Rd
- 26W244 Saint Charles Rd
- 26W272 Saint Charles Rd
- 26W280 Saint Charles Rd
- 26W280 Saint Charles Rd
- 26W308 Saint Charles Rd
- 2N045 Pleasant Hill Rd
- 2 Pleasant Hill Rd
- 26W324 Saint Charles Rd
- 2N063 Pleasant Hill Rd Unit 3
- 26W253 Peterson Ave
- 26W241 Peterson Ave
- 26W265 Peterson Ave
- 26W338 Saint Charles Rd
- 26W275 Peterson Ave
- 26W303 Peterson Ave
- 2N107 Pleasant Hill Rd Unit 3
- 26W317 Peterson Ave
- 26W302 Pinehurst Dr