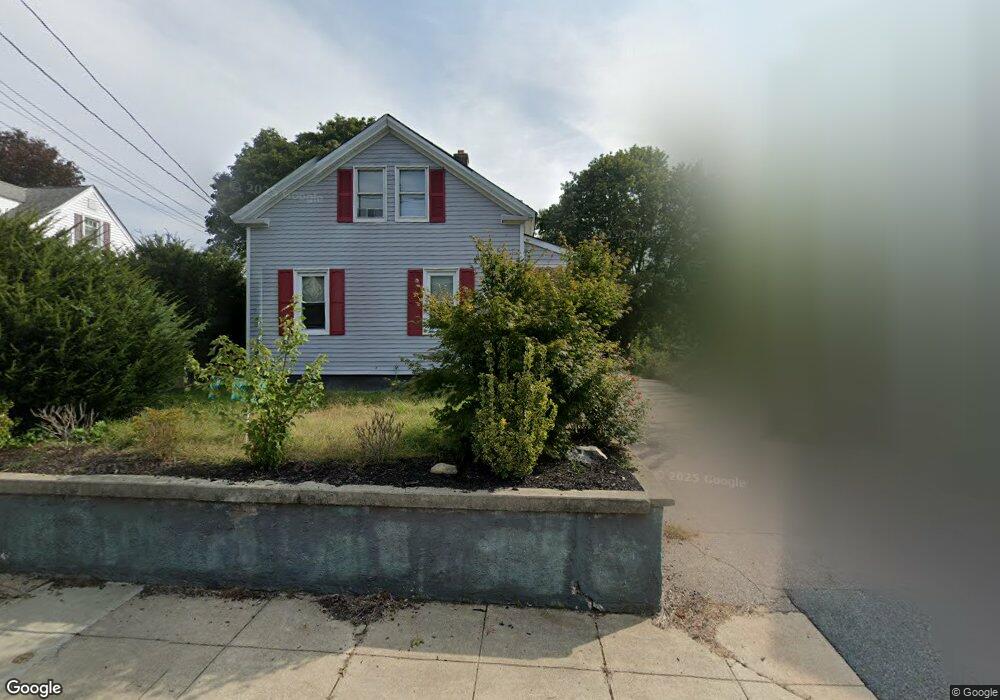
27 1/2 Earl St West Warwick, RI 02893
West Warwick Centre NeighborhoodEstimated Value: $317,000 - $400,000
2
Beds
1
Bath
959
Sq Ft
$377/Sq Ft
Est. Value
About This Home
This home is located at 27 1/2 Earl St, West Warwick, RI 02893 and is currently estimated at $361,938, approximately $377 per square foot. 27 1/2 Earl St is a home located in Kent County with nearby schools including West Warwick High School, Islamic School of Rhode Island, and St Joseph School.
Ownership History
Date
Name
Owned For
Owner Type
Purchase Details
Closed on
Feb 18, 2021
Sold by
North Robert W and North Eleene T
Bought by
Daigle Nicholas A
Current Estimated Value
Purchase Details
Closed on
Sep 9, 2016
Sold by
Obrien Louise G
Bought by
Federal National Mortgage Association
Create a Home Valuation Report for This Property
The Home Valuation Report is an in-depth analysis detailing your home's value as well as a comparison with similar homes in the area
Home Values in the Area
Average Home Value in this Area
Purchase History
| Date | Buyer | Sale Price | Title Company |
|---|---|---|---|
| Daigle Nicholas A | $220,000 | None Available | |
| Federal National Mortgage Association | $81,844 | -- |
Source: Public Records
Tax History Compared to Growth
Tax History
| Year | Tax Paid | Tax Assessment Tax Assessment Total Assessment is a certain percentage of the fair market value that is determined by local assessors to be the total taxable value of land and additions on the property. | Land | Improvement |
|---|---|---|---|---|
| 2025 | $4,408 | $308,500 | $100,400 | $208,100 |
| 2024 | $4,233 | $226,500 | $71,800 | $154,700 |
| 2023 | $4,149 | $226,500 | $71,800 | $154,700 |
| 2022 | $4,086 | $226,500 | $71,800 | $154,700 |
| 2021 | $3,747 | $162,900 | $53,000 | $109,900 |
| 2020 | $3,747 | $162,900 | $53,000 | $109,900 |
| 2019 | $4,776 | $162,900 | $53,000 | $109,900 |
| 2018 | $3,029 | $116,300 | $43,600 | $72,700 |
| 2017 | $3,060 | $116,300 | $43,600 | $72,700 |
| 2016 | $3,005 | $116,300 | $43,600 | $72,700 |
| 2015 | $2,949 | $113,600 | $43,600 | $70,000 |
| 2014 | $2,884 | $113,600 | $43,600 | $70,000 |
Source: Public Records
Map
Nearby Homes