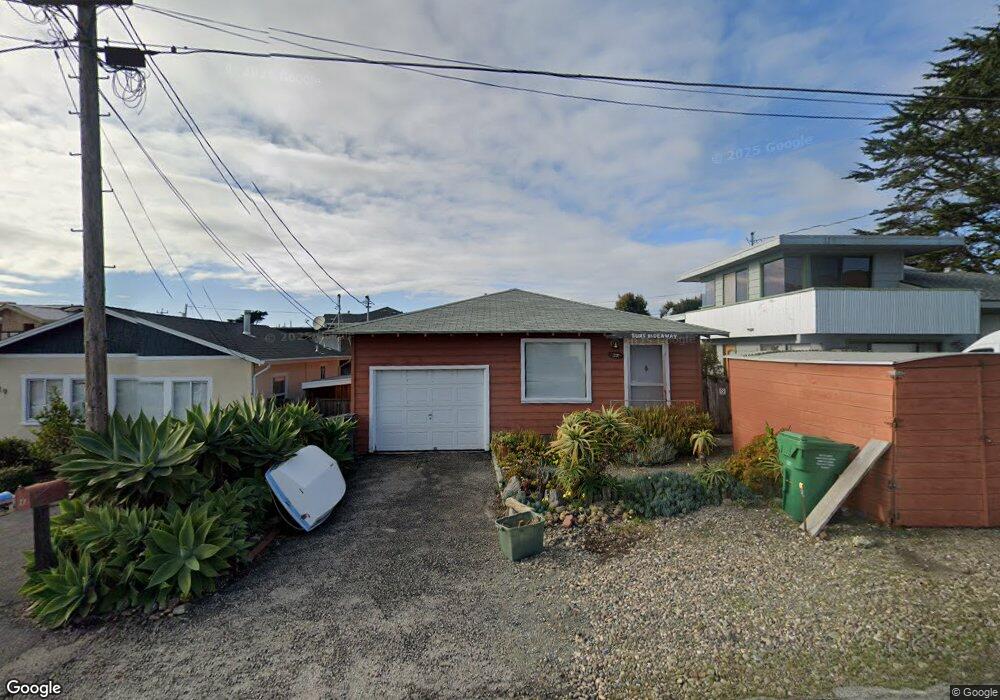
27 9th St Cayucos, CA 93430
Cayucos NeighborhoodEstimated Value: $817,290 - $1,173,000
2
Beds
1
Bath
700
Sq Ft
$1,422/Sq Ft
Est. Value
About This Home
This home is located at 27 9th St, Cayucos, CA 93430 and is currently estimated at $995,073, approximately $1,421 per square foot. 27 9th St is a home located in San Luis Obispo County.
Ownership History
Date
Name
Owned For
Owner Type
Purchase Details
Closed on
Feb 5, 2015
Sold by
Craig Thomas and Craig Laurie
Bought by
The 2015 Thomas & Laurie Craig Family Tr and Craig Laurie
Current Estimated Value
Purchase Details
Closed on
Mar 10, 2000
Sold by
Barcellos Mary
Bought by
Craig Thomas and Craig Laurie
Home Financials for this Owner
Home Financials are based on the most recent Mortgage that was taken out on this home.
Original Mortgage
$160,000
Outstanding Balance
$54,421
Interest Rate
8.34%
Estimated Equity
$940,652
Create a Home Valuation Report for This Property
The Home Valuation Report is an in-depth analysis detailing your home's value as well as a comparison with similar homes in the area
Home Values in the Area
Average Home Value in this Area
Purchase History
| Date | Buyer | Sale Price | Title Company |
|---|---|---|---|
| The 2015 Thomas & Laurie Craig Family Tr | -- | Public | |
| Craig Thomas | $175,000 | First American Title |
Source: Public Records
Mortgage History
| Date | Status | Borrower | Loan Amount |
|---|---|---|---|
| Open | Craig Thomas | $160,000 |
Source: Public Records
Tax History
| Year | Tax Paid | Tax Assessment Tax Assessment Total Assessment is a certain percentage of the fair market value that is determined by local assessors to be the total taxable value of land and additions on the property. | Land | Improvement |
|---|---|---|---|---|
| 2025 | $3,604 | $338,111 | $245,906 | $92,205 |
| 2024 | $3,562 | $331,483 | $241,085 | $90,398 |
| 2023 | $3,562 | $324,984 | $236,358 | $88,626 |
| 2022 | $3,501 | $318,613 | $231,724 | $86,889 |
| 2021 | $3,448 | $312,367 | $227,181 | $85,186 |
| 2020 | $3,411 | $309,165 | $224,852 | $84,313 |
| 2019 | $3,344 | $303,104 | $220,444 | $82,660 |
| 2018 | $3,278 | $297,162 | $216,122 | $81,040 |
| 2017 | $3,212 | $291,336 | $211,885 | $79,451 |
| 2016 | $3,148 | $285,625 | $207,731 | $77,894 |
| 2015 | $3,120 | $281,335 | $204,611 | $76,724 |
| 2014 | $3,012 | $275,825 | $200,603 | $75,222 |
Source: Public Records
Map
Nearby Homes
- 1000 Saint Mary Ave
- 50 5th St
- 510 Park Ave
- 1234 Pacific Ave
- 50 S 3rd St
- 31 N 3rd St
- 1625 Cass Ave Unit 22
- 57 17th St
- 191 J St
- 2023 Circle Dr
- 0 Ash Ave Unit SC25116716
- 96 24th St
- 77 N Ocean Ave Unit 8
- 77 N Ocean Ave Unit 12
- 0 California 1
- 340 D St
- 159 Ash Ave
- 130 Cypress Ave
- 0 Studio Dr
- 349 N Ocean Ave Unit A13
Your Personal Tour Guide
Ask me questions while you tour the home.