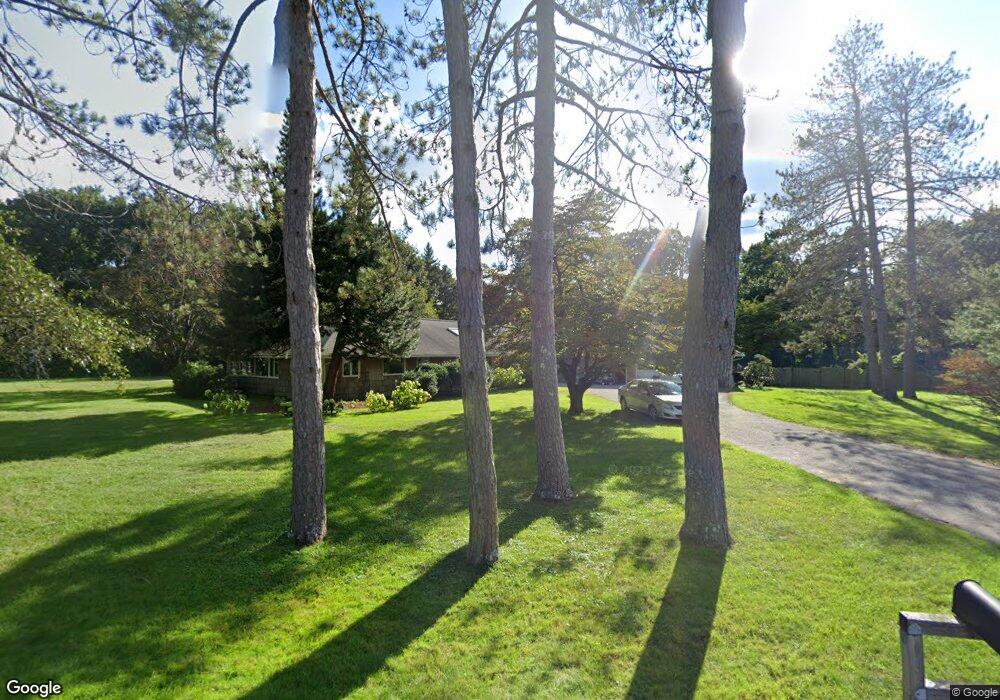
27 Alden Rd Andover, MA 01810
Southern Andover NeighborhoodEstimated Value: $1,292,000 - $1,701,000
3
Beds
3
Baths
3,555
Sq Ft
$428/Sq Ft
Est. Value
About This Home
This home is located at 27 Alden Rd, Andover, MA 01810 and is currently estimated at $1,519,841, approximately $427 per square foot. 27 Alden Rd is a home located in Essex County with nearby schools including South Elementary School, Doherty Middle School, and Andover High School.
Ownership History
Date
Name
Owned For
Owner Type
Purchase Details
Closed on
Oct 13, 2011
Sold by
Alexandris Maria L
Bought by
Ballinger Tanyeli B
Current Estimated Value
Purchase Details
Closed on
Jun 19, 2006
Sold by
Chang Charles S and Hobratsch Lauren V
Bought by
Alexandris Maria L
Purchase Details
Closed on
Sep 8, 2000
Sold by
27 Alden Rd Rt and Axelrod John P
Bought by
Chang Charles S and Hobratsch Lauren
Home Financials for this Owner
Home Financials are based on the most recent Mortgage that was taken out on this home.
Original Mortgage
$300,000
Interest Rate
8.1%
Mortgage Type
Purchase Money Mortgage
Purchase Details
Closed on
Dec 16, 1999
Sold by
Axelrod Evelyn
Bought by
27 Alden Road Rt and Marrett Louis J
Create a Home Valuation Report for This Property
The Home Valuation Report is an in-depth analysis detailing your home's value as well as a comparison with similar homes in the area
Home Values in the Area
Average Home Value in this Area
Purchase History
| Date | Buyer | Sale Price | Title Company |
|---|---|---|---|
| Ballinger Tanyeli B | $675,000 | -- | |
| Alexandris Maria L | $779,000 | -- | |
| Chang Charles S | $600,000 | -- | |
| 27 Alden Road Rt | $550,000 | -- |
Source: Public Records
Mortgage History
| Date | Status | Borrower | Loan Amount |
|---|---|---|---|
| Previous Owner | 27 Alden Road Rt | $275,000 | |
| Previous Owner | 27 Alden Road Rt | $125,000 | |
| Previous Owner | 27 Alden Road Rt | $300,000 |
Source: Public Records
Tax History Compared to Growth
Tax History
| Year | Tax Paid | Tax Assessment Tax Assessment Total Assessment is a certain percentage of the fair market value that is determined by local assessors to be the total taxable value of land and additions on the property. | Land | Improvement |
|---|---|---|---|---|
| 2024 | $13,438 | $1,043,300 | $601,000 | $442,300 |
| 2023 | $12,892 | $943,800 | $542,600 | $401,200 |
| 2022 | $12,009 | $822,500 | $473,800 | $348,700 |
| 2021 | $11,532 | $754,200 | $432,000 | $322,200 |
| 2020 | $11,076 | $737,900 | $422,000 | $315,900 |
| 2019 | $10,614 | $695,100 | $386,700 | $308,400 |
| 2018 | $10,291 | $658,000 | $372,300 | $285,700 |
| 2017 | $9,853 | $649,100 | $365,300 | $283,800 |
| 2016 | $9,612 | $648,600 | $365,300 | $283,300 |
| 2015 | $9,292 | $620,700 | $351,800 | $268,900 |
Source: Public Records
Map
Nearby Homes