
Landlord's Agent in 2023
Grace Bloodwell
Coldwell Banker Realty - Boston
(617) 512-4939
42 in this area
118 Total Sales
Estimated Value: $1,044,000 - $1,196,000
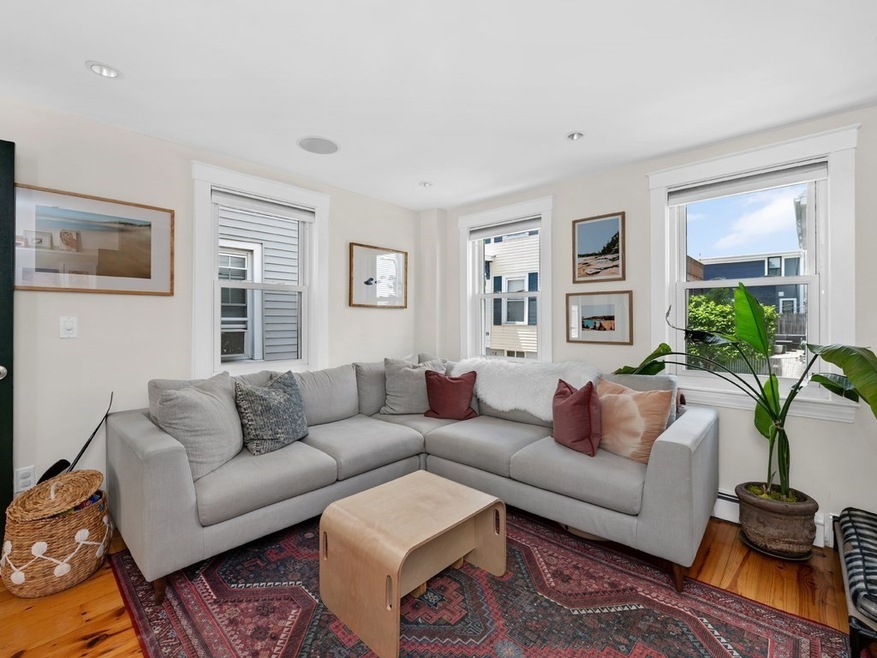
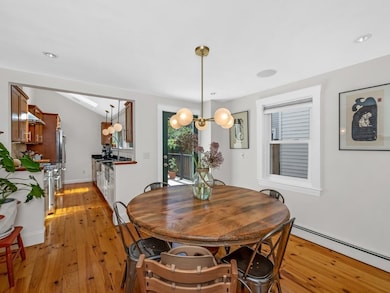
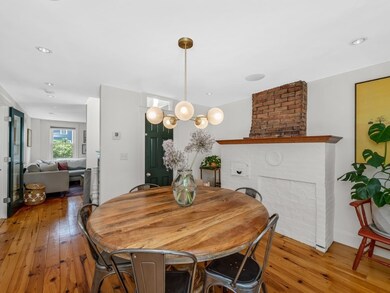
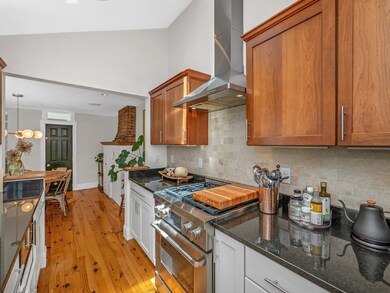
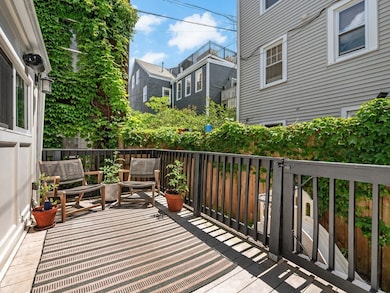
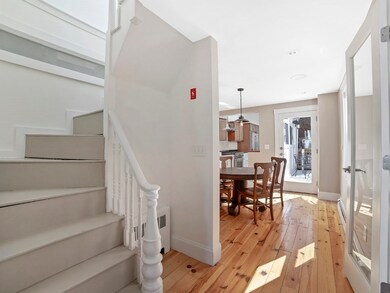
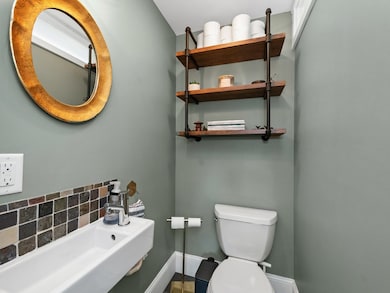
6 month or 1 year lease opportunity. Cheerful, bright and polished 3BD single family in Charlestown with modern kitchen, deck and wonderful flow. The private side-facing entrance opens to thoughtfully designed foyer with skylight and large entry closet for shoes and coats. First floor features a formal dining room with original brick walls and pumpkin pine flooring; separate living room, tastefully decorated half-bath and a bright kitchen with stainless steel appliances and granite countertops. Off the dining room, is a large private deck - perfect for al fresco dining and entertaining. The second floor features the primary bedroom and newly renovated and oversized spa-like bathroom w/marble accents. The third floor houses two bedrooms, each with closets. The basement provides additional storage and features a washer and dryer. Other: Hot water on demand, three exposures, great location near to Waverly, bus line, Orange Line and the shops and restaurants of Charlestown.
Last Agent to Rent the Property
Coldwell Banker Realty - Boston Listed on: 08/03/2023
| Date | Buyer | Sale Price | Title Company |
|---|---|---|---|
| Brady Christopher J | $705,000 | -- | |
| Nevin Corey F | $278,500 | -- | |
| Nevin Corey F | $278,500 | -- |
| Date | Status | Borrower | Loan Amount |
|---|---|---|---|
| Open | Brady Christopher J | $681,470 | |
| Previous Owner | Nevin Corey F | $304,000 | |
| Previous Owner | Nevin Corey F | $12,300 |
| Date | Event | Price | List to Sale | Price per Sq Ft |
|---|---|---|---|---|
| 09/03/2023 09/03/23 | Rented | $4,000 | -11.1% | -- |
| 08/21/2023 08/21/23 | Price Changed | $4,500 | -10.0% | $4 / Sq Ft |
| 08/14/2023 08/14/23 | Price Changed | $5,000 | -9.1% | $4 / Sq Ft |
| 08/03/2023 08/03/23 | For Rent | $5,500 | +57.1% | -- |
| 06/25/2017 06/25/17 | Rented | $3,500 | 0.0% | -- |
| 06/22/2017 06/22/17 | Under Contract | -- | -- | -- |
| 06/06/2017 06/06/17 | Price Changed | $3,500 | -2.8% | $2 / Sq Ft |
| 05/18/2017 05/18/17 | Price Changed | $3,600 | -5.3% | $2 / Sq Ft |
| 03/27/2017 03/27/17 | For Rent | $3,800 | 0.0% | -- |
| 03/02/2017 03/02/17 | Off Market | $3,800 | -- | -- |
| 02/28/2017 02/28/17 | For Rent | $3,800 | 0.0% | -- |
| 06/19/2015 06/19/15 | Rented | $3,800 | 0.0% | -- |
| 05/20/2015 05/20/15 | Under Contract | -- | -- | -- |
| 04/23/2015 04/23/15 | For Rent | $3,800 | -- | -- |
| Year | Tax Paid | Tax Assessment Tax Assessment Total Assessment is a certain percentage of the fair market value that is determined by local assessors to be the total taxable value of land and additions on the property. | Land | Improvement |
|---|---|---|---|---|
| 2025 | $9,915 | $856,200 | $300,000 | $556,200 |
| 2024 | $8,553 | $784,700 | $258,100 | $526,600 |
| 2023 | $8,027 | $747,400 | $245,800 | $501,600 |
| 2022 | $7,393 | $679,500 | $223,500 | $456,000 |
| 2021 | $7,107 | $666,100 | $219,100 | $447,000 |
| 2020 | $6,411 | $607,100 | $210,400 | $396,700 |
| 2019 | $6,271 | $595,000 | $168,300 | $426,700 |
| 2018 | $5,885 | $561,500 | $168,300 | $393,200 |
| 2017 | $5,504 | $519,700 | $168,300 | $351,400 |
| 2016 | $5,343 | $485,700 | $168,300 | $317,400 |
| 2015 | $5,526 | $456,300 | $168,500 | $287,800 |
| 2014 | $5,066 | $402,700 | $168,500 | $234,200 |
Landlord's Agent in 2023
Grace Bloodwell
Coldwell Banker Realty - Boston
(617) 512-4939
42 in this area
118 Total Sales
C
Tenant's Agent in 2023
Christopher Dye
DyeNamic Properties
1 in this area
9 Total Sales
Source: MLS Property Information Network (MLS PIN)
MLS Number: 73144272
APN: CHAR-000000-000002-001738
Disclaimer: Certain information contained herein is derived from information provided by parties other than Homes.com. All information provided is deemed reliable, but is not guaranteed to be accurate and should be independently verified.
![]() The property listing data and information, or the Images, set forth herein were provided to MLS Property Information Network, Inc. from third party sources, including sellers, lessors and public records, and were compiled by MLS Property Information Network, Inc. The property listing data and information, and the Images, are for the personal, non-commercial use of consumers having a good faith interest in purchasing or leasing listed properties of the type displayed to them and may not be used for any purpose other than to identify prospective properties which such consumers may have a good faith interest in purchasing or leasing. MLS Property Information Network, Inc. and its subscribers disclaim any and all representations and warranties as to the accuracy of the property listing data and information, or as to the accuracy of any of the Images, set forth herein.
The property listing data and information, or the Images, set forth herein were provided to MLS Property Information Network, Inc. from third party sources, including sellers, lessors and public records, and were compiled by MLS Property Information Network, Inc. The property listing data and information, and the Images, are for the personal, non-commercial use of consumers having a good faith interest in purchasing or leasing listed properties of the type displayed to them and may not be used for any purpose other than to identify prospective properties which such consumers may have a good faith interest in purchasing or leasing. MLS Property Information Network, Inc. and its subscribers disclaim any and all representations and warranties as to the accuracy of the property listing data and information, or as to the accuracy of any of the Images, set forth herein.