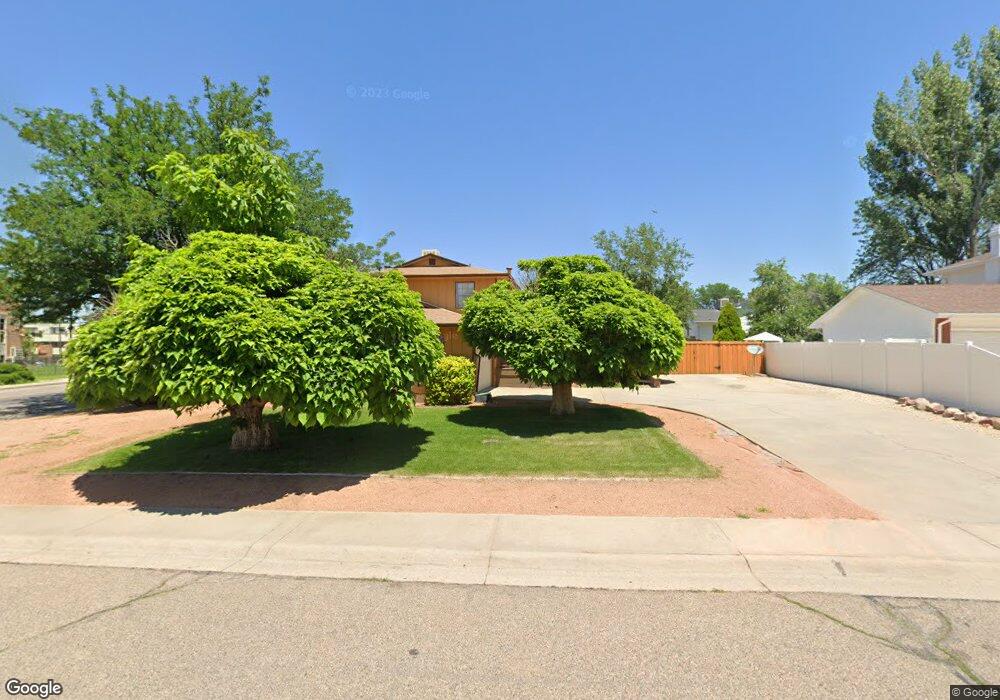
27 Apollo Ln Pueblo, CO 81001
Belmont NeighborhoodEstimated Value: $311,000 - $364,000
4
Beds
3
Baths
1,942
Sq Ft
$171/Sq Ft
Est. Value
About This Home
This home is located at 27 Apollo Ln, Pueblo, CO 81001 and is currently estimated at $331,898, approximately $170 per square foot. 27 Apollo Ln is a home located in Pueblo County with nearby schools including Belmont Elementary School, Heaton Middle School, and East High School.
Ownership History
Date
Name
Owned For
Owner Type
Purchase Details
Closed on
Jul 17, 2025
Sold by
Masciantonio-Miller Deanna
Bought by
Deanna Sue Masciantonio-Miller Revocable Trus
Current Estimated Value
Purchase Details
Closed on
Aug 6, 2024
Sold by
Pueblo County
Bought by
Housman Brett Robert
Purchase Details
Closed on
Aug 9, 2019
Sold by
Masciantonio Brady Gavin Paul
Bought by
Masciantonio Miller Deanna
Purchase Details
Closed on
Feb 16, 2019
Sold by
Mass Frank S
Bought by
Mastiantonio Brady Gavina
Purchase Details
Closed on
Jul 15, 2008
Sold by
Rider Linda and Masciantonio Frank S
Bought by
Mass Frank and Masciantonio Brady Deanna
Purchase Details
Closed on
Aug 21, 2002
Sold by
Masciantonio Frank S
Bought by
Mass and Masciantonio
Purchase Details
Closed on
Jan 3, 1973
Sold by
Landscaping Of Pueblo Inc
Bought by
Masciantonio Frank S
Create a Home Valuation Report for This Property
The Home Valuation Report is an in-depth analysis detailing your home's value as well as a comparison with similar homes in the area
Home Values in the Area
Average Home Value in this Area
Purchase History
| Date | Buyer | Sale Price | Title Company |
|---|---|---|---|
| Deanna Sue Masciantonio-Miller Revocable Trus | -- | None Listed On Document | |
| Housman Brett Robert | $6,136 | None Listed On Document | |
| Masciantonio Miller Deanna | -- | None Available | |
| Mastiantonio Brady Gavina | -- | None Available | |
| Mass Frank | -- | None Available | |
| Mass | -- | -- | |
| Masciantonio Frank S | $37,900 | -- |
Source: Public Records
Tax History Compared to Growth
Tax History
| Year | Tax Paid | Tax Assessment Tax Assessment Total Assessment is a certain percentage of the fair market value that is determined by local assessors to be the total taxable value of land and additions on the property. | Land | Improvement |
|---|---|---|---|---|
| 2024 | $1,601 | $16,330 | -- | -- |
| 2023 | $1,619 | $20,020 | $1,340 | $18,680 |
| 2022 | $1,514 | $15,250 | $1,390 | $13,860 |
| 2021 | $1,562 | $15,690 | $1,430 | $14,260 |
| 2020 | $1,379 | $15,690 | $1,430 | $14,260 |
| 2019 | $1,380 | $13,666 | $1,073 | $12,593 |
| 2018 | $1,008 | $11,124 | $1,080 | $10,044 |
| 2017 | $1,018 | $11,124 | $1,080 | $10,044 |
| 2016 | $966 | $10,631 | $1,194 | $9,437 |
| 2015 | $962 | $10,631 | $1,194 | $9,437 |
| 2014 | $955 | $10,532 | $1,194 | $9,338 |
Source: Public Records
Map
Nearby Homes
- 39 Apollo Ln
- 2 Hilton Ln
- 55 Bonnymede Rd Unit S
- 55 Bonnymede Rd
- 1827 Seminole Ln
- 6 Pineridge Ct
- 1925 Mohawk Rd
- 1909 Mohawk Rd
- 2 Alan Shepard Rd Unit 8
- 146 Douglas Ln
- 136 Douglas Ln
- 36 Scotland Rd
- 5 Douglas Ln
- 13 Ironbridge Ln
- 1918 Cuchara Dr
- 130 Scotland Rd Unit D
- 172 Bonnymede Rd
- 172 Bonnymede Rd Unit A
- 172 Bonnymede Rd Unit C
- 6 Crownbridge Ct
- 29 Apollo Ln
- 26 Bonnymede Rd Unit 28
- 30 Bonnymede Rd Unit 32
- 31 Apollo Ln
- 26 Apollo Ln
- 34 Bonnymede Rd Unit 36
- 28 Apollo Ln
- 30 Apollo Ln
- 33 Apollo Ln
- 38 Bonnymede Rd Unit 40
- 2001 Jerry Murphy Rd
- 27 Calhoun Rd
- 32 Apollo Ln
- 29 Calhoun Rd
- 35 Apollo Ln
- 42 Bonnymede Rd Unit 44
- 31 Calhoun Rd
- 0 Apollo Ln
- 1915 Jerry Murphy Rd Unit 1921
- 33 Calhoun Rd