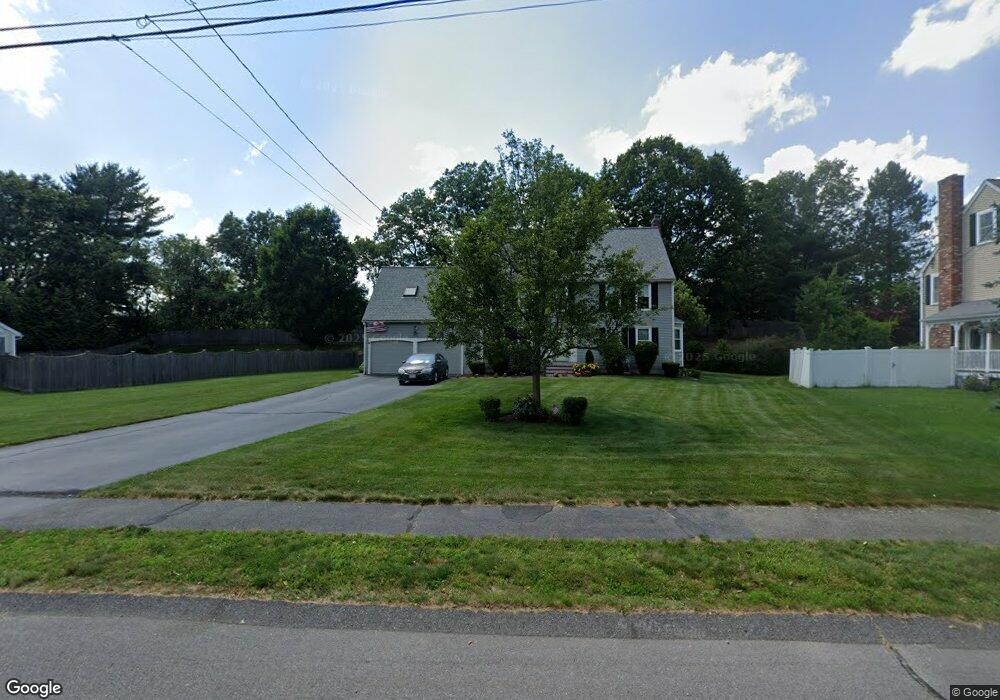
27 Audubon Dr Walpole, MA 02081
Estimated Value: $653,000 - $1,036,000
4
Beds
3
Baths
2,381
Sq Ft
$376/Sq Ft
Est. Value
About This Home
This home is located at 27 Audubon Dr, Walpole, MA 02081 and is currently estimated at $894,201, approximately $375 per square foot. 27 Audubon Dr is a home located in Norfolk County with nearby schools including Elm Street School, Eleanor N. Johnson Middle School, and Walpole High School.
Ownership History
Date
Name
Owned For
Owner Type
Purchase Details
Closed on
Jun 4, 1992
Sold by
Windham Corp
Bought by
Rose Patrick R
Current Estimated Value
Purchase Details
Closed on
Mar 20, 1992
Sold by
Thibault Tr George A
Bought by
Windham Corp
Create a Home Valuation Report for This Property
The Home Valuation Report is an in-depth analysis detailing your home's value as well as a comparison with similar homes in the area
Home Values in the Area
Average Home Value in this Area
Purchase History
| Date | Buyer | Sale Price | Title Company |
|---|---|---|---|
| Rose Patrick R | $225,000 | -- | |
| Windham Corp | $70,000 | -- |
Source: Public Records
Mortgage History
| Date | Status | Borrower | Loan Amount |
|---|---|---|---|
| Open | Windham Corp | $100,000 | |
| Closed | Windham Corp | $110,000 | |
| Closed | Windham Corp | $10,000 |
Source: Public Records
Tax History
| Year | Tax Paid | Tax Assessment Tax Assessment Total Assessment is a certain percentage of the fair market value that is determined by local assessors to be the total taxable value of land and additions on the property. | Land | Improvement |
|---|---|---|---|---|
| 2025 | $10,274 | $800,800 | $350,600 | $450,200 |
| 2024 | $9,941 | $752,000 | $337,100 | $414,900 |
| 2023 | $9,481 | $682,600 | $293,100 | $389,500 |
| 2022 | $8,884 | $614,400 | $271,500 | $342,900 |
| 2021 | $8,732 | $588,400 | $256,100 | $332,300 |
| 2020 | $8,418 | $561,600 | $241,600 | $320,000 |
| 2019 | $8,121 | $537,800 | $232,300 | $305,500 |
| 2018 | $7,913 | $518,200 | $224,200 | $294,000 |
| 2017 | $7,950 | $518,600 | $215,700 | $302,900 |
| 2016 | $7,595 | $488,100 | $199,100 | $289,000 |
| 2015 | $7,305 | $465,300 | $189,700 | $275,600 |
| 2014 | $7,456 | $473,100 | $189,700 | $283,400 |
Source: Public Records
Map
Nearby Homes
- 1391 Main St Unit 308
- 1391 Main St Unit 306
- 1391 Main St Unit 304
- 145 South St Unit 5
- 26 Drake Cir
- 1110 Main St
- 9 Pearl St
- 50 Riverside Place
- 10 Sandtrap Cir Unit 2
- 31 Sandtrap Cir Unit 500
- 13 Sandtrap Cir Unit 14
- 11 Sandtrap Cir Unit 15
- 20 Sandtrap Cir Unit 4
- 19 Sandtrap Cir Unit 11
- 14 Weathervane Dr Unit 22
- 18 Sandtrap Cir Unit 3
- 17 Sandtrap Cir Unit 12
- 15 Sandtrap Cir Unit 13
- 20 Forrest Rd
- 25 Sandtrap Cir Unit 8
Your Personal Tour Guide
Ask me questions while you tour the home.