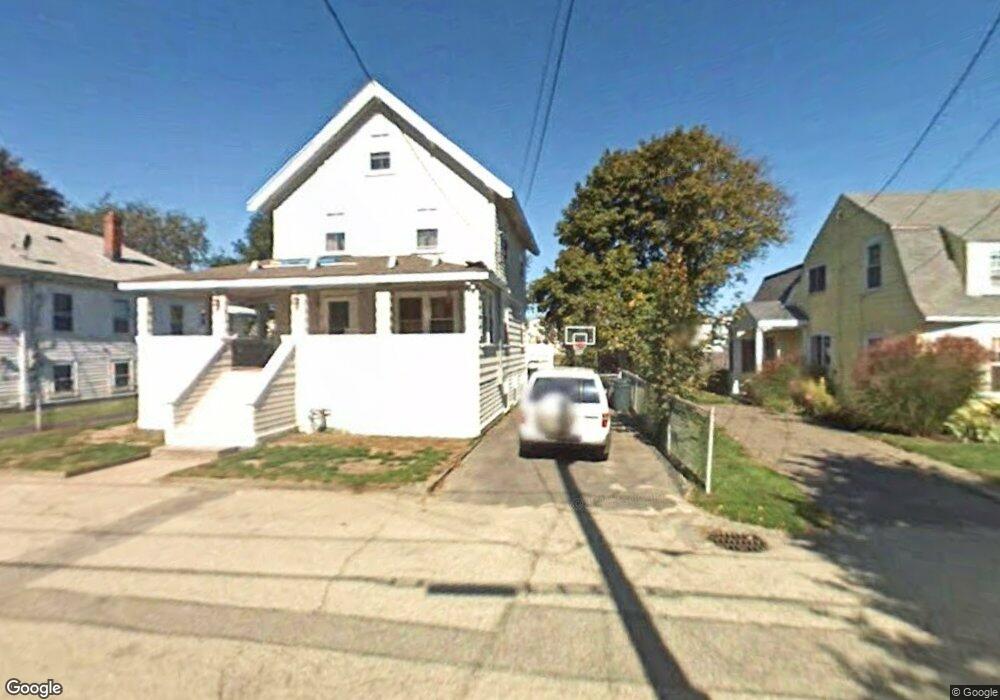
27 B St Hull, MA 02045
The Alphabets NeighborhoodEstimated Value: $663,000 - $956,000
3
Beds
1
Bath
2,572
Sq Ft
$303/Sq Ft
Est. Value
About This Home
This home is located at 27 B St, Hull, MA 02045 and is currently estimated at $779,326, approximately $303 per square foot. 27 B St is a home located in Plymouth County with nearby schools including Lillian M. Jacobs Elementary School, Memorial Middle School, and Hull High School.
Ownership History
Date
Name
Owned For
Owner Type
Purchase Details
Closed on
Aug 11, 2025
Sold by
Petriella Louis S and Petriella Terri A
Bought by
Petriella Ret and Petriella
Current Estimated Value
Purchase Details
Closed on
Apr 25, 2005
Sold by
Demko Carol Ann
Bought by
Petriella Louis S and Petriella Terri A
Home Financials for this Owner
Home Financials are based on the most recent Mortgage that was taken out on this home.
Original Mortgage
$152,000
Interest Rate
5.87%
Mortgage Type
Purchase Money Mortgage
Create a Home Valuation Report for This Property
The Home Valuation Report is an in-depth analysis detailing your home's value as well as a comparison with similar homes in the area
Home Values in the Area
Average Home Value in this Area
Purchase History
| Date | Buyer | Sale Price | Title Company |
|---|---|---|---|
| Petriella Ret | -- | -- | |
| Petriella Louis S | $304,000 | -- |
Source: Public Records
Mortgage History
| Date | Status | Borrower | Loan Amount |
|---|---|---|---|
| Previous Owner | Petriella Louis S | $100,000 | |
| Previous Owner | Petriella Louis S | $152,000 |
Source: Public Records
Tax History
| Year | Tax Paid | Tax Assessment Tax Assessment Total Assessment is a certain percentage of the fair market value that is determined by local assessors to be the total taxable value of land and additions on the property. | Land | Improvement |
|---|---|---|---|---|
| 2025 | $6,505 | $580,800 | $265,100 | $315,700 |
| 2024 | $6,469 | $555,300 | $252,900 | $302,400 |
| 2023 | $6,169 | $506,900 | $244,700 | $262,200 |
| 2022 | $5,999 | $478,400 | $228,400 | $250,000 |
| 2021 | $5,626 | $443,700 | $204,000 | $239,700 |
| 2020 | $5,457 | $425,700 | $212,100 | $213,600 |
| 2019 | $5,170 | $396,200 | $195,800 | $200,400 |
| 2018 | $5,020 | $374,100 | $195,800 | $178,300 |
| 2017 | $4,950 | $360,800 | $195,800 | $165,000 |
| 2016 | $4,644 | $344,500 | $179,500 | $165,000 |
| 2015 | $4,405 | $316,000 | $150,900 | $165,100 |
| 2014 | $4,214 | $303,800 | $138,700 | $165,100 |
Source: Public Records
Map
Nearby Homes
Your Personal Tour Guide
Ask me questions while you tour the home.