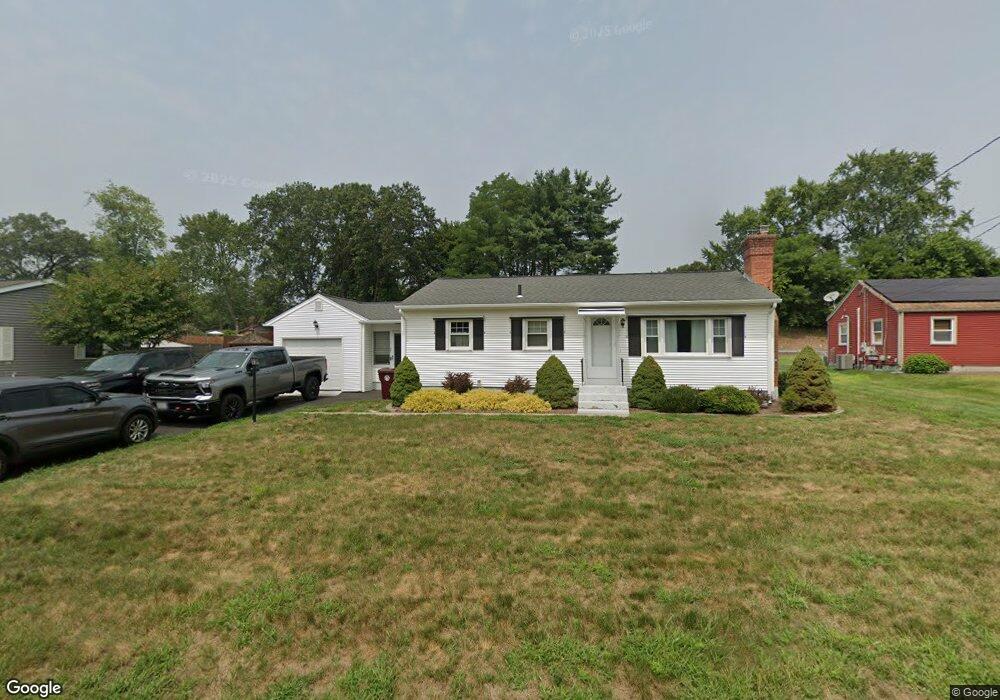
27 Barre Dr Ludlow, MA 01056
Estimated Value: $305,000 - $344,000
3
Beds
1
Bath
988
Sq Ft
$337/Sq Ft
Est. Value
About This Home
This home is located at 27 Barre Dr, Ludlow, MA 01056 and is currently estimated at $332,726, approximately $336 per square foot. 27 Barre Dr is a home located in Hampden County with nearby schools including East Street Elementary School, Chapin Street Elementary School, and Paul R. Baird Middle School.
Ownership History
Date
Name
Owned For
Owner Type
Purchase Details
Closed on
Sep 23, 2020
Sold by
Costa Anthony R and Sawa Donna M
Bought by
Melnick Christopher J
Current Estimated Value
Home Financials for this Owner
Home Financials are based on the most recent Mortgage that was taken out on this home.
Original Mortgage
$180,000
Outstanding Balance
$159,375
Interest Rate
2.9%
Mortgage Type
New Conventional
Estimated Equity
$173,351
Purchase Details
Closed on
Sep 29, 2006
Sold by
Costa Anthony R
Bought by
Costa Anthony R and Sawa Donna M
Create a Home Valuation Report for This Property
The Home Valuation Report is an in-depth analysis detailing your home's value as well as a comparison with similar homes in the area
Home Values in the Area
Average Home Value in this Area
Purchase History
| Date | Buyer | Sale Price | Title Company |
|---|---|---|---|
| Melnick Christopher J | $225,000 | None Available | |
| Melnick Christopher J | $225,000 | None Available | |
| Costa Anthony R | -- | -- | |
| Costa Anthony R | -- | -- |
Source: Public Records
Mortgage History
| Date | Status | Borrower | Loan Amount |
|---|---|---|---|
| Open | Melnick Christopher J | $180,000 | |
| Closed | Melnick Christopher J | $180,000 |
Source: Public Records
Tax History
| Year | Tax Paid | Tax Assessment Tax Assessment Total Assessment is a certain percentage of the fair market value that is determined by local assessors to be the total taxable value of land and additions on the property. | Land | Improvement |
|---|---|---|---|---|
| 2025 | $5,535 | $319,000 | $73,500 | $245,500 |
| 2024 | $5,309 | $293,500 | $73,300 | $220,200 |
| 2023 | $4,913 | $251,800 | $61,000 | $190,800 |
| 2022 | $4,618 | $231,000 | $61,000 | $170,000 |
| 2021 | $4,593 | $217,900 | $61,000 | $156,900 |
| 2020 | $3,390 | $164,400 | $60,000 | $104,400 |
| 2019 | $3,141 | $158,500 | $59,500 | $99,000 |
| 2018 | $2,973 | $156,400 | $59,500 | $96,900 |
| 2017 | $2,961 | $159,800 | $60,600 | $99,200 |
| 2016 | $2,872 | $158,400 | $62,800 | $95,600 |
| 2015 | $2,723 | $157,500 | $62,200 | $95,300 |
Source: Public Records
Map
Nearby Homes
- 295 Main St
- 201 Main St
- 0 N S Main St Io
- 166-168 Main St
- 57 Belmont St
- Lot 602 Grandview Ave
- 46-48 Milton St
- 96 Lyons St
- 39 Rogers Ave
- 115 Hampden St
- 0 Fuller St Unit 73409741
- 33 Connolly St
- 350 West Ave Unit 5
- 34-36 Mazarin St
- 189 Essex St Unit K
- 189 Essex St Unit H
- 70 Fuller St
- 1045-1047 Worcester St
- 0 Center St Unit 73415933
- 59 Prospect Gardens
Your Personal Tour Guide
Ask me questions while you tour the home.