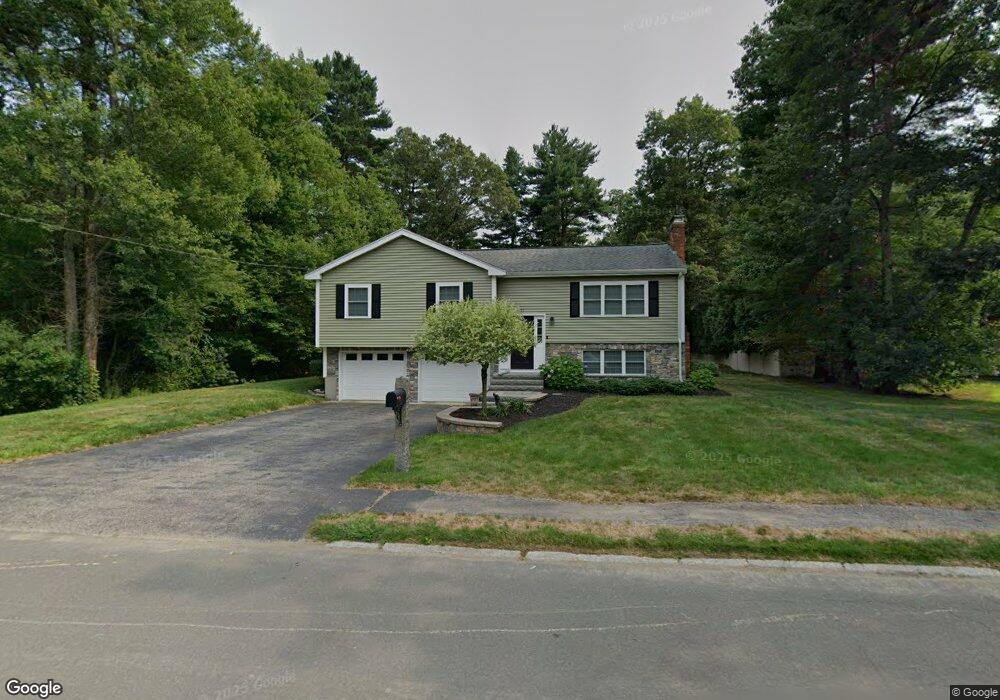
27 Barton Rd Foxboro, MA 02035
Estimated Value: $569,855 - $691,000
3
Beds
2
Baths
1,126
Sq Ft
$561/Sq Ft
Est. Value
About This Home
This home is located at 27 Barton Rd, Foxboro, MA 02035 and is currently estimated at $631,214, approximately $560 per square foot. 27 Barton Rd is a home located in Norfolk County with nearby schools including Foxborough High School, Hands-On-Montessori School, and Cadence Academy Preschool - North Attleborough.
Ownership History
Date
Name
Owned For
Owner Type
Purchase Details
Closed on
Nov 22, 2010
Sold by
Lashua Jonathan C
Bought by
Lashua Jonathan C and Devita Kara M
Current Estimated Value
Home Financials for this Owner
Home Financials are based on the most recent Mortgage that was taken out on this home.
Original Mortgage
$264,800
Outstanding Balance
$174,978
Interest Rate
4.3%
Mortgage Type
Purchase Money Mortgage
Estimated Equity
$456,236
Purchase Details
Closed on
May 22, 1998
Sold by
Mcloughlin Mtthew J and Mcloughlin Jill
Bought by
Mosesso Patrick F and Mosesso Lynn M
Home Financials for this Owner
Home Financials are based on the most recent Mortgage that was taken out on this home.
Original Mortgage
$130,000
Interest Rate
7.03%
Mortgage Type
Purchase Money Mortgage
Create a Home Valuation Report for This Property
The Home Valuation Report is an in-depth analysis detailing your home's value as well as a comparison with similar homes in the area
Home Values in the Area
Average Home Value in this Area
Purchase History
| Date | Buyer | Sale Price | Title Company |
|---|---|---|---|
| Lashua Jonathan C | -- | -- | |
| Mosesso Patrick F | $201,000 | -- |
Source: Public Records
Mortgage History
| Date | Status | Borrower | Loan Amount |
|---|---|---|---|
| Closed | Mosesso Patrick F | $25,000 | |
| Open | Lashua Jonathan C | $264,800 | |
| Previous Owner | Mosesso Patrick F | $267,000 | |
| Previous Owner | Mosesso Patrick F | $130,000 | |
| Previous Owner | Mosesso Patrick F | $130,000 |
Source: Public Records
Tax History Compared to Growth
Tax History
| Year | Tax Paid | Tax Assessment Tax Assessment Total Assessment is a certain percentage of the fair market value that is determined by local assessors to be the total taxable value of land and additions on the property. | Land | Improvement |
|---|---|---|---|---|
| 2025 | $6,720 | $508,300 | $239,400 | $268,900 |
| 2024 | $6,548 | $484,700 | $243,700 | $241,000 |
| 2023 | $6,387 | $449,500 | $232,100 | $217,400 |
| 2022 | $5,791 | $398,800 | $194,600 | $204,200 |
| 2021 | $5,413 | $367,200 | $180,200 | $187,000 |
| 2020 | $5,063 | $347,500 | $180,200 | $167,300 |
| 2019 | $4,939 | $336,000 | $171,600 | $164,400 |
| 2018 | $4,814 | $330,400 | $171,600 | $158,800 |
| 2017 | $4,569 | $303,800 | $160,400 | $143,400 |
| 2016 | $4,619 | $311,700 | $161,600 | $150,100 |
| 2015 | $4,398 | $289,500 | $136,700 | $152,800 |
| 2014 | $4,205 | $280,500 | $127,700 | $152,800 |
Source: Public Records
Map
Nearby Homes
- 406 South St
- 24 Maverick Dr
- 16 Treasure Island Rd
- 4 Buckskin Dr
- 450 West St
- 80 Mill St
- 9 Oak Dr
- 150 Gilbert St
- 116 George St
- 277 Central St
- 356 Central St
- 231 Spring St
- 166 Chauncy St
- 11 Landry Ave
- 28 Messenger St
- 12 Spring St
- 196 Donald Tennant Cir
- 126 Washington St
- 130 Washington St
- 124 Washington St