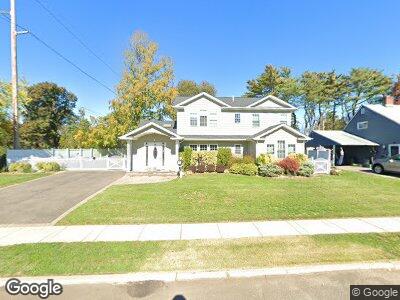
27 Booth Ln Levittown, NY 11756
Levittown NeighborhoodEstimated Value: $832,968 - $932,000
4
Beds
3
Baths
2,226
Sq Ft
$396/Sq Ft
Est. Value
About This Home
This home is located at 27 Booth Ln, Levittown, NY 11756 and is currently estimated at $882,484, approximately $396 per square foot. 27 Booth Ln is a home located in Nassau County with nearby schools including Holy Family School and Holy Trinity Diocesan High School.
Ownership History
Date
Name
Owned For
Owner Type
Purchase Details
Closed on
Nov 7, 2023
Sold by
Yue Xihua and Yue Yuan
Bought by
Yue Yuan
Current Estimated Value
Purchase Details
Closed on
Apr 14, 2016
Sold by
Island Wide Homebuyers Llc and Island Wide Homebuyers Llc
Bought by
Yue Xihua and Yue Yuan
Home Financials for this Owner
Home Financials are based on the most recent Mortgage that was taken out on this home.
Original Mortgage
$481,510
Outstanding Balance
$392,081
Interest Rate
3.71%
Mortgage Type
New Conventional
Estimated Equity
$464,483
Purchase Details
Closed on
Mar 3, 2015
Sold by
Destefano Diane and Estate Of Carter Edward Curry
Bought by
Island Wide Homebuyers Llc
Create a Home Valuation Report for This Property
The Home Valuation Report is an in-depth analysis detailing your home's value as well as a comparison with similar homes in the area
Home Values in the Area
Average Home Value in this Area
Purchase History
| Date | Buyer | Sale Price | Title Company |
|---|---|---|---|
| Yue Yuan | -- | None Available | |
| Yue Yuan | -- | None Available | |
| Yue Xihua | $601,888 | The Judicial Title Insurance | |
| Yue Xihua | $601,888 | The Judicial Title Insurance | |
| Island Wide Homebuyers Llc | $261,000 | Abstracts Incorporated | |
| Island Wide Homebuyers Llc | $261,000 | Abstracts Incorporated |
Source: Public Records
Mortgage History
| Date | Status | Borrower | Loan Amount |
|---|---|---|---|
| Open | Yue Xihua | $481,510 | |
| Closed | Yue Xihua | $481,510 |
Source: Public Records
Tax History Compared to Growth
Tax History
| Year | Tax Paid | Tax Assessment Tax Assessment Total Assessment is a certain percentage of the fair market value that is determined by local assessors to be the total taxable value of land and additions on the property. | Land | Improvement |
|---|---|---|---|---|
| 2024 | $4,879 | $555 | $312 | $243 |
| 2023 | $16,244 | $614 | $345 | $269 |
| 2022 | $16,244 | $614 | $345 | $269 |
| 2021 | $23,245 | $596 | $335 | $261 |
| 2020 | $18,529 | $1,125 | $643 | $482 |
| 2019 | $19,476 | $1,125 | $643 | $482 |
| 2018 | $18,724 | $984 | $0 | $0 |
| 2017 | $8,023 | $815 | $643 | $172 |
| 2016 | $12,284 | $815 | $643 | $172 |
| 2015 | $3,897 | $815 | $643 | $172 |
| 2014 | $3,897 | $815 | $643 | $172 |
| 2013 | $3,580 | $815 | $643 | $172 |
Source: Public Records
Map
Nearby Homes