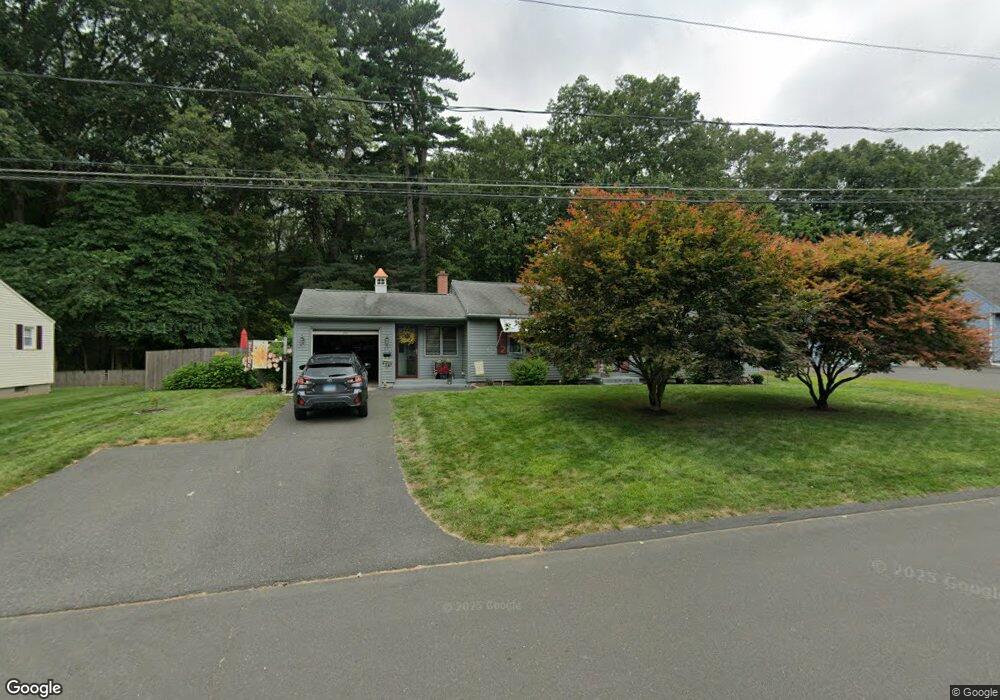
27 Boyle Dr Enfield, CT 06082
Estimated Value: $342,000 - $351,901
3
Beds
2
Baths
1,470
Sq Ft
$235/Sq Ft
Est. Value
About This Home
This home is located at 27 Boyle Dr, Enfield, CT 06082 and is currently estimated at $345,975, approximately $235 per square foot. 27 Boyle Dr is a home located in Hartford County with nearby schools including Eli Whitney Elementary School, Hazardville Memorial Elementary School, and John F. Kennedy Middle School.
Ownership History
Date
Name
Owned For
Owner Type
Purchase Details
Closed on
Sep 29, 2022
Sold by
Sutter Betty A
Bought by
Hughes Mary
Current Estimated Value
Purchase Details
Closed on
Apr 1, 2021
Sold by
Hughes Sean
Bought by
Sutter Betty A and Hughes Mary
Purchase Details
Closed on
Aug 28, 2018
Sold by
Sutter Betty A
Bought by
Hughes Sean
Create a Home Valuation Report for This Property
The Home Valuation Report is an in-depth analysis detailing your home's value as well as a comparison with similar homes in the area
Home Values in the Area
Average Home Value in this Area
Purchase History
| Date | Buyer | Sale Price | Title Company |
|---|---|---|---|
| Hughes Mary | -- | None Available | |
| Sutter Betty A | -- | None Available | |
| Hughes Sean | -- | -- |
Source: Public Records
Mortgage History
| Date | Status | Borrower | Loan Amount |
|---|---|---|---|
| Previous Owner | Hughes Sean | $35,000 |
Source: Public Records
Tax History Compared to Growth
Tax History
| Year | Tax Paid | Tax Assessment Tax Assessment Total Assessment is a certain percentage of the fair market value that is determined by local assessors to be the total taxable value of land and additions on the property. | Land | Improvement |
|---|---|---|---|---|
| 2025 | $5,934 | $169,600 | $56,600 | $113,000 |
| 2024 | $5,775 | $169,600 | $56,600 | $113,000 |
| 2023 | $5,732 | $169,600 | $56,600 | $113,000 |
| 2022 | $5,205 | $169,600 | $56,600 | $113,000 |
| 2021 | $4,961 | $132,190 | $46,890 | $85,300 |
| 2020 | $4,961 | $132,190 | $46,890 | $85,300 |
| 2019 | $4,974 | $132,190 | $46,890 | $85,300 |
| 2018 | $4,891 | $132,190 | $46,890 | $85,300 |
| 2017 | $4,617 | $132,190 | $46,890 | $85,300 |
| 2016 | $4,699 | $136,950 | $48,110 | $88,840 |
| 2015 | $4,552 | $136,950 | $48,110 | $88,840 |
| 2014 | $4,434 | $136,950 | $48,110 | $88,840 |
Source: Public Records
Map
Nearby Homes
- 10-1/2 South Rd
- 15 Sun St
- 12 Dune Rd
- 84 Raffia Rd
- 6 Ellis Rd
- 5 Vernon Rd
- 40 Beech Rd
- 92 Post Office Rd
- 67 Middle Rd
- 33 Liberty Ln
- 38 Liberty Ln
- 37 Liberty Ln
- 35 Liberty Ln
- 83 Oldefield Farms Unit 83
- 85 Oldefield Farms Unit 85
- 233 Post Office Rd
- 5 Spier Ave
- 1165 Enfield St Unit 11
- 18 Hudson St
- 3 Riverdale Rd