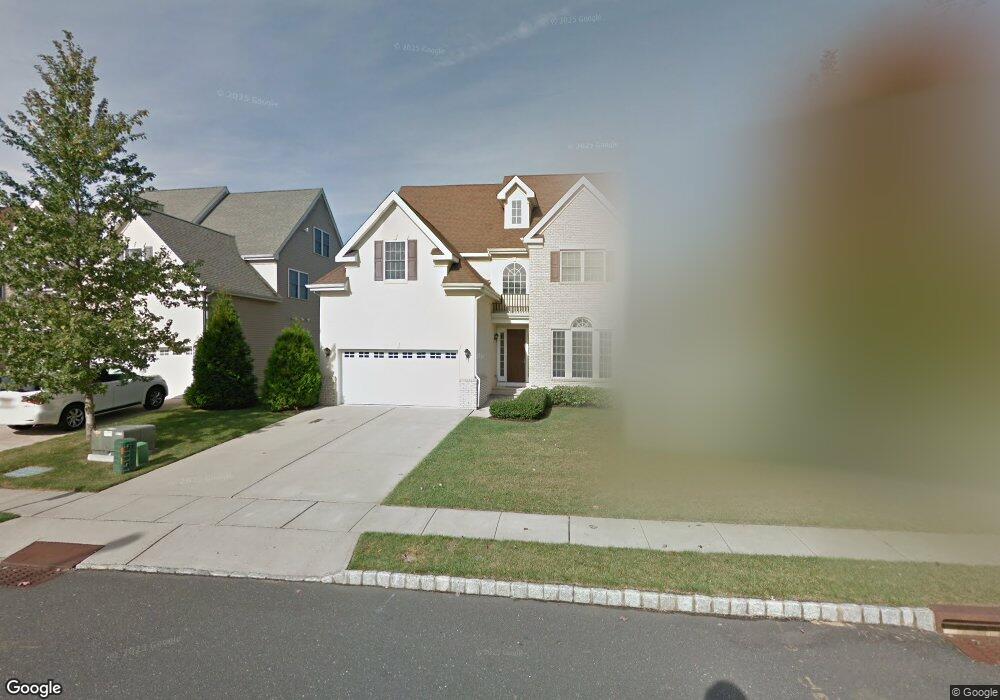
27 Chad Ln Howell, NJ 07731
Adelphia NeighborhoodEstimated Value: $775,000 - $830,000
4
Beds
3
Baths
2,712
Sq Ft
$296/Sq Ft
Est. Value
About This Home
This home is located at 27 Chad Ln, Howell, NJ 07731 and is currently estimated at $803,490, approximately $296 per square foot. 27 Chad Ln is a home located in Monmouth County with nearby schools including Griebling School, Howell Township Memorial Elementary School, and Howell Middle School North.
Ownership History
Date
Name
Owned For
Owner Type
Purchase Details
Closed on
Feb 23, 2006
Sold by
Mrc At Fort Plains Road Llc
Bought by
Sabuwala Jemin and Sabuwala H
Current Estimated Value
Home Financials for this Owner
Home Financials are based on the most recent Mortgage that was taken out on this home.
Original Mortgage
$300,000
Outstanding Balance
$168,488
Interest Rate
6.16%
Mortgage Type
New Conventional
Estimated Equity
$635,002
Create a Home Valuation Report for This Property
The Home Valuation Report is an in-depth analysis detailing your home's value as well as a comparison with similar homes in the area
Home Values in the Area
Average Home Value in this Area
Purchase History
| Date | Buyer | Sale Price | Title Company |
|---|---|---|---|
| Sabuwala Jemin | $412,400 | -- |
Source: Public Records
Mortgage History
| Date | Status | Borrower | Loan Amount |
|---|---|---|---|
| Open | Sabuwala Jemin | $300,000 |
Source: Public Records
Tax History
| Year | Tax Paid | Tax Assessment Tax Assessment Total Assessment is a certain percentage of the fair market value that is determined by local assessors to be the total taxable value of land and additions on the property. | Land | Improvement |
|---|---|---|---|---|
| 2025 | $11,180 | $701,700 | $306,200 | $395,500 |
| 2024 | $11,131 | $639,200 | $246,200 | $393,000 |
| 2023 | $11,131 | $607,900 | $221,200 | $386,700 |
| 2022 | $10,524 | $523,200 | $146,200 | $377,000 |
| 2021 | $10,524 | $466,500 | $131,200 | $335,300 |
| 2020 | $10,417 | $456,500 | $121,200 | $335,300 |
| 2019 | $10,592 | $454,600 | $121,200 | $333,400 |
| 2018 | $10,607 | $452,700 | $98,700 | $354,000 |
| 2017 | $10,464 | $441,900 | $98,700 | $343,200 |
| 2016 | $10,404 | $433,300 | $98,700 | $334,600 |
| 2015 | $10,608 | $437,100 | $111,200 | $325,900 |
| 2014 | $10,146 | $385,200 | $126,200 | $259,000 |
Source: Public Records
Map
Nearby Homes
- 32 Firestone Dr
- 2 Bracken Ct
- 12 Alydar Ct
- 80 Secretariat St Unit 66
- 83 Seattle Slew Dr
- 71 Seattle Slew Dr
- 7 Charles St
- 7 Lourdes Ct
- 10 Citrus Ln
- 21 Essex Ln
- 806 W Farms Rd
- 269 Stuart St
- 20 Grace Ln
- 7 Grace Ln
- 174 Pinetree Ct
- 156 Pinetree Ct Unit 156
- 116 Cypress Ct
- 84 Briarwood Ct
- 425 Winterberry Ct
- 432 Winterberry Ct
Your Personal Tour Guide
Ask me questions while you tour the home.