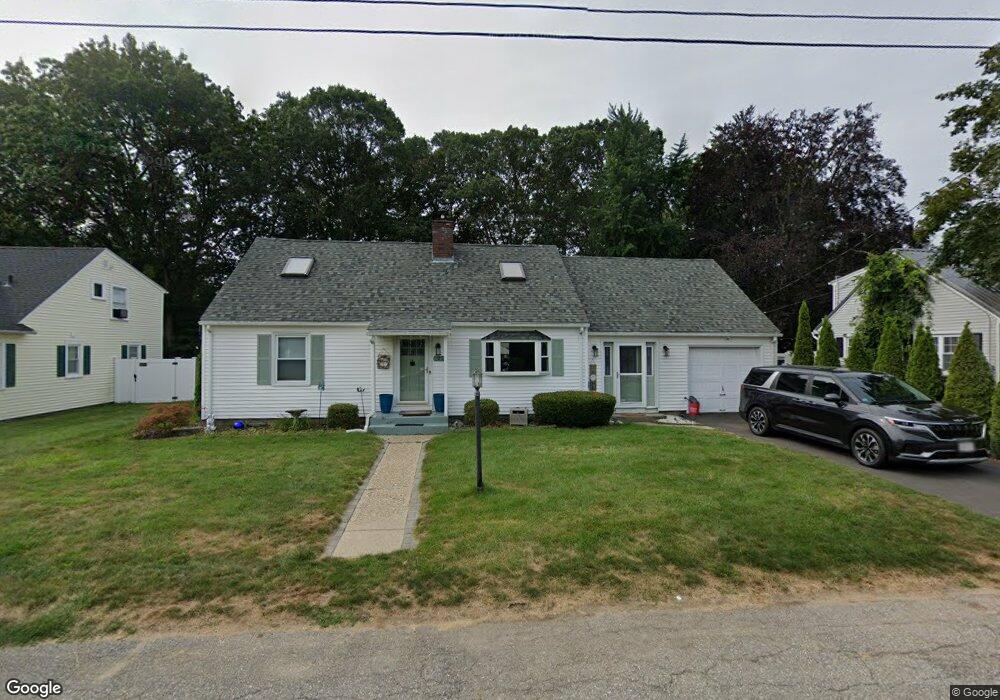
27 Chapin Cir Unit 1 Ludlow, MA 01056
Estimated Value: $381,640 - $406,000
4
Beds
2
Baths
2,196
Sq Ft
$179/Sq Ft
Est. Value
About This Home
This home is located at 27 Chapin Cir Unit 1, Ludlow, MA 01056 and is currently estimated at $392,910, approximately $178 per square foot. 27 Chapin Cir Unit 1 is a home located in Hampden County with nearby schools including East Street Elementary School, Chapin Street Elementary School, and Paul R. Baird Middle School.
Ownership History
Date
Name
Owned For
Owner Type
Purchase Details
Closed on
Mar 23, 2018
Sold by
Housden Michael F and Housden Kelli A
Bought by
Sawabi Dylan J and Sawabi Julie A
Current Estimated Value
Home Financials for this Owner
Home Financials are based on the most recent Mortgage that was taken out on this home.
Original Mortgage
$202,410
Outstanding Balance
$172,821
Interest Rate
4.32%
Mortgage Type
New Conventional
Estimated Equity
$220,089
Purchase Details
Closed on
Jun 30, 2005
Sold by
Zilaro Joseph A and Zilaro Kathleen A
Bought by
Housden Kelli A and Housden Michael F
Home Financials for this Owner
Home Financials are based on the most recent Mortgage that was taken out on this home.
Original Mortgage
$125,100
Interest Rate
5.73%
Mortgage Type
Purchase Money Mortgage
Purchase Details
Closed on
Apr 13, 1987
Sold by
Rostkowski Marie
Bought by
Gosselin Kathleen A
Create a Home Valuation Report for This Property
The Home Valuation Report is an in-depth analysis detailing your home's value as well as a comparison with similar homes in the area
Home Values in the Area
Average Home Value in this Area
Purchase History
| Date | Buyer | Sale Price | Title Company |
|---|---|---|---|
| Sawabi Dylan J | $224,900 | -- | |
| Sawabi Dylan J | $224,900 | -- | |
| Housden Kelli A | $286,000 | -- | |
| Housden Kelli A | $286,000 | -- | |
| Gosselin Kathleen A | $60,000 | -- |
Source: Public Records
Mortgage History
| Date | Status | Borrower | Loan Amount |
|---|---|---|---|
| Open | Sawabi Dylan J | $202,410 | |
| Closed | Sawabi Dylan J | $202,410 | |
| Previous Owner | Gosselin Kathleen A | $208,000 | |
| Previous Owner | Housden Kelli A | $125,100 |
Source: Public Records
Tax History Compared to Growth
Tax History
| Year | Tax Paid | Tax Assessment Tax Assessment Total Assessment is a certain percentage of the fair market value that is determined by local assessors to be the total taxable value of land and additions on the property. | Land | Improvement |
|---|---|---|---|---|
| 2025 | $5,425 | $312,700 | $71,100 | $241,600 |
| 2024 | $5,152 | $284,800 | $71,100 | $213,700 |
| 2023 | $4,815 | $246,800 | $59,100 | $187,700 |
| 2022 | $4,530 | $226,600 | $59,100 | $167,500 |
| 2021 | $4,507 | $213,800 | $59,100 | $154,700 |
| 2020 | $4,314 | $209,200 | $58,200 | $151,000 |
| 2019 | $4,065 | $205,100 | $57,700 | $147,400 |
| 2018 | $3,792 | $199,500 | $57,700 | $141,800 |
| 2017 | $3,630 | $195,900 | $58,700 | $137,200 |
| 2016 | $3,437 | $189,600 | $57,500 | $132,100 |
| 2015 | $3,223 | $186,400 | $56,900 | $129,500 |
Source: Public Records
Map
Nearby Homes
- 51 Parkview St
- 70 Sroka Ln
- 84 Chapin Greene Dr
- 142 Amherst St
- 148 Yale St
- 517 Ideal Ln Unit 401
- 87 Haviland St
- 42 Loopley St
- 60 Loopley St
- 32 White St
- 138 Ridgeview Cir
- 41 Orchard St
- 665 Center St Unit 705
- 665 Center St Unit 311
- 665 Center St Unit 706
- 98 Fuller St Unit 32
- 84 Fuller St Unit 1
- 70 Fuller St
- 415 Winsor St
- 287 East St
- 27 Chapin Cir
- 35 Chapin Cir
- 21 Chapin Cir
- 24 Chapin Cir
- 48 Chapin Cir
- 0 Mountainview St
- 28 Mountainview St
- 28 Mountainview St
- 64 Parkview St
- 539 Chapin St
- 545 Chapin St
- 74 Parkview St
- 16 Mountainview St
- 58 Chapin Cir
- 549 Chapin St
- 92 Parkview St
- 38 Parkview St
- 51 Chapin Cir
- 553 Chapin St
- 535 Chapin St