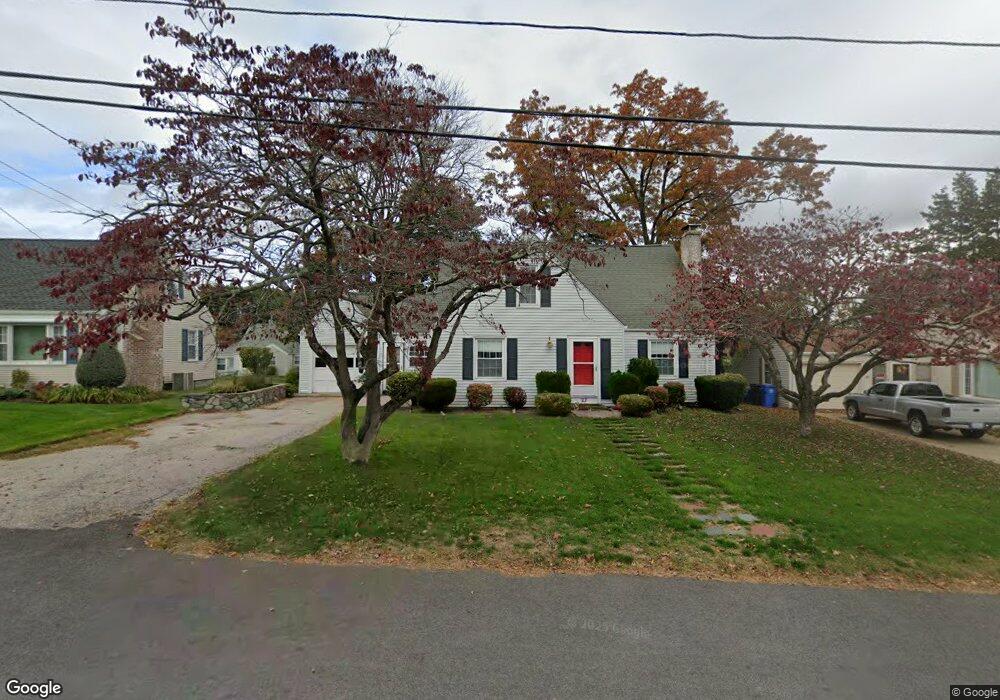
27 Coulters Rd Cranston, RI 02920
Meshanticut NeighborhoodEstimated Value: $483,808 - $679,000
3
Beds
2
Baths
2,139
Sq Ft
$269/Sq Ft
Est. Value
About This Home
This home is located at 27 Coulters Rd, Cranston, RI 02920 and is currently estimated at $575,952, approximately $269 per square foot. 27 Coulters Rd is a home located in Providence County with nearby schools including Woodridge Elementary School, Western Hills Middle School, and Cranston High School West.
Ownership History
Date
Name
Owned For
Owner Type
Purchase Details
Closed on
Jun 18, 2010
Sold by
Shepherd Randall and Shepherd Catherine
Bought by
Alvarez Neil A
Current Estimated Value
Home Financials for this Owner
Home Financials are based on the most recent Mortgage that was taken out on this home.
Original Mortgage
$229,970
Outstanding Balance
$154,579
Interest Rate
5.03%
Mortgage Type
Purchase Money Mortgage
Estimated Equity
$421,373
Purchase Details
Closed on
Aug 31, 2001
Sold by
Verrecchia Stephen and Verrecchia Gina M
Bought by
Shepherd Randall and Shepard Catherine
Home Financials for this Owner
Home Financials are based on the most recent Mortgage that was taken out on this home.
Original Mortgage
$158,000
Interest Rate
7.06%
Purchase Details
Closed on
Oct 15, 1992
Sold by
Bruno Louis A and Bruno Patricia
Bought by
Verrecchia Stephen and Verrecchia Gina
Home Financials for this Owner
Home Financials are based on the most recent Mortgage that was taken out on this home.
Original Mortgage
$112,910
Interest Rate
7.93%
Create a Home Valuation Report for This Property
The Home Valuation Report is an in-depth analysis detailing your home's value as well as a comparison with similar homes in the area
Home Values in the Area
Average Home Value in this Area
Purchase History
| Date | Buyer | Sale Price | Title Company |
|---|---|---|---|
| Alvarez Neil A | $250,000 | -- | |
| Shepherd Randall | $190,000 | -- | |
| Verrecchia Stephen | $135,500 | -- |
Source: Public Records
Mortgage History
| Date | Status | Borrower | Loan Amount |
|---|---|---|---|
| Open | Verrecchia Stephen | $229,970 | |
| Previous Owner | Verrecchia Stephen | $158,000 | |
| Previous Owner | Verrecchia Stephen | $112,910 |
Source: Public Records
Tax History Compared to Growth
Tax History
| Year | Tax Paid | Tax Assessment Tax Assessment Total Assessment is a certain percentage of the fair market value that is determined by local assessors to be the total taxable value of land and additions on the property. | Land | Improvement |
|---|---|---|---|---|
| 2025 | $5,473 | $394,300 | $106,400 | $287,900 |
| 2024 | $5,366 | $394,300 | $106,400 | $287,900 |
| 2023 | $5,557 | $294,000 | $73,400 | $220,600 |
| 2022 | $5,442 | $294,000 | $73,400 | $220,600 |
| 2021 | $5,292 | $294,000 | $73,400 | $220,600 |
| 2020 | $5,105 | $245,800 | $76,900 | $168,900 |
| 2019 | $5,105 | $245,800 | $76,900 | $168,900 |
| 2018 | $4,987 | $245,800 | $76,900 | $168,900 |
| 2017 | $4,723 | $205,900 | $69,900 | $136,000 |
| 2016 | $4,622 | $205,900 | $69,900 | $136,000 |
| 2015 | $4,622 | $205,900 | $69,900 | $136,000 |
| 2014 | $4,413 | $193,200 | $69,900 | $123,300 |
Source: Public Records
Map
Nearby Homes
- 10 Sheffield Rd
- 446 Budlong Rd
- 141 Glen Ridge Rd
- 28 Hybrid Dr
- 0 Rutland St
- 46 Lilyana Way
- 69 W View Ave
- 275 Meshanticut Valley Pkwy
- 132 Fordson Ave Unit 12
- 99 Salem Ave
- 113 Fordson Ave
- 210 Hyde St
- 105 Fordson Ave
- 51 E Bel Air Rd
- 111 Belgium St
- 34 Keller Ave
- 200 Hoffman Ave Unit 505
- 45 Hamden Rd
- 145 E Hill Dr
- 26 Keith Ave